3D Navigation in architectural
space
The use of Voronoi diagram for
mapping information flows
Mohammed Raafat Saleh MSc BSc, Christian
Derix MSc DiplArch, Paul Coates AA Dipl
Center for Evolutionary Computing
in Architecture (CECA)
School of
Architecture and Visual Arts
University of
East London
The spatial environment is regarded as a system that
has its structure and configuration. The phenomena or manifestations of this
system are present all over the space in the form of visual information bits or
can also be referred to as ‘knowledge in world’; implicitly embedded in the
elements of the system. Therefore, once our environment changes, the available
knowledge and thus the phenomena also change. For Raubal and Worboys [Raubal and Worboys 1999], the knowledge in the
world is present in many forms and on many cognitive levels. At a lowest level
of awareness this knowledge can be regarded as being in the overall
configuration and underlying structure of the spatial system.
We used the notion of ‘way-finding’ in attempt to
uncover the phenomenal manifestations of an architectural space and so we could
define it. The notion could show the underlying structure of the space
throughout the people's behavior and navigation within this space, Way-finding
is known as a combination of cognitive abilities with which spatial
characteristics may be recognized and organized into coherent patterns. These
abilities are collecting spatial information, information processing and
decision making, as well as manipulating the space. We believe that these
abilities require a spatial mapping system that quantifies the spatial aspects
and represents its configuration.
We
constructed an analytical software tool to study the impact of spatial
configurations on people’s abilities to navigate and way-find. The structure of
the analytical tool is based on computational geomtries that are referred to as Voronoi diagrams and its dual
concept Delaunay triangulation. These diagrams are generally regarded as
structural tessellations, which define the optimum boundaries between
elements in space (be that on an urban,
architectural or engineering scale). Here, the Voronoi has been applied as a
representational network that maps
architectural space in three dimensions and simultaneously evolves an
analytical structure of the intelligibility of the space it is embedded in.
The
mechanism of this evolution depends on running the three mentioned way-finding
abilities sequentially. The nodes of the voronoi diagram are a metaphorical
representation of spatial sensory points that carry visual information about
the environment, whereas its edges (a line connecting two nodes) represent the
paths which the nodes employ as navigational routes towards a target location.
After the routes are chosen, the whole structure reorganises itself and adjusts
its geometric elements’ locations on the basis of the taken decisions and the
weight values that are assigned to each node, indicating the number of times
this node has been used. The adjusting stage in turn feeds back the new
locations of the elements to the decision making stage before the sequence
loops.
Eventually,
the Voronoi diagram evolves into an emergent route pattern of paths chosen and
omitted to navigate from a a start point to a target point within a given
space. Comparing various evolved patterns – patterns vary by chosing different
emitters and targets, or chaning the given space – we were able to understand
some idiosyncrasies of the space the network was embedded in and assess their
impacts on the process of way-finding.
The
paper starts at section [1] by introducing parts of the body of literature
concerning space cognition, cognitive maps and their relation to people’s
way-finding. Section [2] will describe Passini’s definition of way-finding and
some of his rules considered when selecting the next step. Section[3] shows the
importance of defining the space via a visual representation and its relation
to our spatial understanding and cognition. Section[4] briefly explain Voronoi
diagrams and their dual concept Delaunay triangulation. The reasons for
commonly using it as a visualising system will be explained in section[5]. The
mechanical processes and the used algorithms of each of the way-finding
abilities for this project are outlined in section[6]. Section[7] will fully
describe one of the experiments that have been performed to test the
feasibility of the tool in reading a 3D space. Finally,
chapter [8] will conclude the paper and suggest further methods for additional
analysis and space readings.
1.Space
cognition and Navigation:
What are the cognitive
mechanisms involved in understanding the spatial relationships between
ourselves and other objects in the world?
The
term ‘spatial cognition’ is used to describe those processes controlling
behavior that must be directed to particular location, as well as those
responses that depend on location or spatial arrangement of stimuli. And
‘Navigation’ refers to the process of strategic route planning and wayfinding,
where ‘wayfinding’ is defined as dynamic step-by-step decision-making process
which required negotiating a path to destination [Golledge].As
a spatial behavior, negotiation demands a cognitive representation that
distinguishes one place or spatial arrangement of stimuli from another. This
representation is referred as cognitive map.
A Cognitive map is a structure which is an internal representation of an environment which its inhabitants use as a reference when navigating to a destination [Passini 1992].It is proposed that cognitive maps fall into two types. First linear or sequential maps which are based on movement through the space and sequential images of route and what is observed in the journey. Second, Spatial maps that don’t require this reference movement through the imagined space. Normally person’s cognitive map changes over time. When we are new to an area our cognitive map will be linear but this will usually evolve to become increasingly spatial [Piaget and Inhelder].
2.Wayfinding as behavioral
abilities:
If
‘spatial cognition’ is defined as the process that governs people’s behaviour
in a space, then it is vital to understand what is already known about this
behavior; the act of what has come to be termed as ‘wayfinding’.Wayfinding has
always been an interesting topic to researchers to investigate the relationship
between space and its occupiers and also
an important issue to
professions like urban, interior or lighting practices in order to reduce the
probability of problem occurrence due to poor way finding systems in their
sites. Such problems could be: Retail sites lose
business, visitors to museums miss exhibits, and patients arrive late and
stressed at hospitals. Getting lost is a negative experience that affects
people’s opinion of their organizations.
Among the different definitions of ‘wayfinding’, I
found Passini’s definition is the most relevant to this paper. In his paper [Aurther1992] defined ‘finding a way’ as a process
of spatial problem solving. It is regarded as a combination of cognitive and
behavioral abilities such as processing, understanding and manipulating space.
To be more precise, the abilities can be classified into i) decision
making ii) decision executing iii) information processing [Passini 1984:1998].People tend to base their decisions in wayfinding tasks
upon the cognised information about their environment. For instance if they can
see their target location certain criteria are used in choosing their
route, whilst different ones are used if they can’t see it. Some of these
criteria are:-
1.The
shortest path towards the seen target location [Peponis].
2.Selection of longest-leg
first[Peponis]
3.Avoidance of unnecessary
back regression [Peponis].
4.Routes with minimum
angle between itself and the target.
5.Routes with maximum
capacities (for example main roads)
Then
in order to reach a destination, decisions have to be transferred into actions.
According to [Arthur and Passini, 1992] the
execution of a decision involves the matching of a mental representation
(cognitive map) of the environment with the real environment itself. Both
decision making and execution are supported by information processing .Spatial
perception (related to the process of acquiring knowledge from the environment)
and spatial reasoning (related to the manipulation of spatial information)
constitutes the main interrelated components [Passini].
3. Metric and Non metric Visual
representation
Since
the availability of relevant information about the environment is an important
factor for decision making ,’wayfinding’ researchers regard the idea of
visual mapping that could represents and quantifies aspects of the built
environment is an essential knowledge instrument for supporting the processing of
this information. In other words, the above mentioned behaviour abilities
that are carried in the domain of cognitive representation is most understood
by focusing on a visual mapping (representation) of the real
environment.Unfortunately, the majority of the researchers who are concerned
with this idea assume that the architectural space is only a Euclidean 2D space
and thus they base their spatial experiments upon metric maps such as 2D route
and tube maps. But does our understanding and cognition to the occupied space
is a metric understanding? In fact we can argue that space is metric at least
when we experience it on the local scale but,’ when we consider the way we
know or understand configuration of space –let us call this cognitive space we
seem to be faced with conundrum ‘[Alan Penn
2000].Nerlich in 1994 mentioned that there are four axioms that should
be satisfied in the Euclidean 3d or 2d metric space. One of them that distance
from x to y must be the same as the distance from y to x.Cognitively the
distance of the route in one direction appears different in the opposite
direction and thus cognitive space breaks up this axiom and appears not to be
metric.
Many
researchers have attempted to understand how the cognitive space is constructed
and how it influences our decisions when navigation. Bill Hiller for example
pointed out that the occupier knows about a space (whether urban or building
interior space) via the difference in the succession of his visibility field
when navigating this space. Upon this observation, he developed ‘axial line
sight’ structure that has been used in many of the space syntax researches. The
structure has based upon extending lines (fewest and longest) that are tangent
to the vertices of blocks until they intersect and so could cover a more global view of the spatial elements in
order to explore the full limits of visibility and permeability within an urban space.[Hiller
and Penn at al,1998].
Another
researcher is Conroy Dalton. She adopted the concept of analyisng the
underlying structure of an architectural space using the traces of moving
people in a virtual environment (VE).The traces were regarded as bottom-up
spatial representation that helped her in noticing ‘Conservation of
linearity’.Basically, the conservation of linearity leads a person to choose
one route from A to B (starting point to a target point) and quite different
route back from B to A. She also showed that this ‘asymmetry’ also holds if one
chooses next step on basis of heading towards a destination; people tend to
have good sense of direction and can compute the route with minimum angle
heading from amongst those on offer.
Conroy and Bill Hillier concluded that people’s cognitive understanding to the space doesn’t follow the Euclidean metric space but a more ‘fundamental and rather simpler as topological or pre-topological space’. This might imply that we need to look for a different representing tool that essentially respects the characteristic aspects of an architectural space and our cognitive understanding to there aspects.
Route
from start to target could be different route back. ‘Axial line sight’ of alpha world
4. Voronoi diagram as a Visualizing system:
In order to describe a space we need to extract the
characteristic aspects (phenomena) of this space. This might happen via
analyzing people’s abilities in cognizing and manipulating the space. These
abilities as said could be facilitated if we constructed a visual mapping
system that manifest the space characteristics and structure in terms of a
coherent topological patterns like the representing systems that have been used
by Hillier; line sight network and Conroy; people’s traces.
In this paper, the visual representation that has been
used, is based on mathematical computational
geomtries that are referred to as
Voronoi diagram and its dual concept Deluanay triangulation.They were first discussed by a mathmatecian called
Petter-Lejeune-Dirichle in 1850 then the diagrams were written in 1920 by
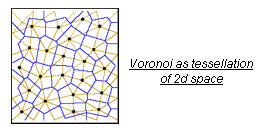
Voronoi as a dual concept,hence the name Voronoi diagram.The geometries could describe some of the
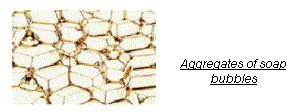
aggreagting superstructures that are found in nature such as Crystaline and
soap bubble aggreagtes.The diagrams have been always regarded as tesselating
structures that represent proximity information about a set of objects or
sites;it partitiones a space into subregions called voronoi cells and assign
every space to its nearest subregion.
Unfortunately,
the majority of Voronoi/Delaunay spatial applications have only concerned with
their mathmatical metric and optimum geometric properties which gave a very limited view about the vononoi
potentials. Therefore we decided to explore more of the voronoi spatial
properties by taking its geometric structure and use it in more abstract
sense.In the experiments that we did,the voronoi was used as a visualising
network instead of diagrams.
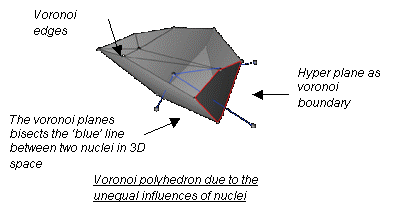
Generally
in order to construct a voronoi diagram,the ‘voronoi cells’ or subregions
require starting points which could be refered to as the ‘nuclei’.By following Voronoi’s algorithm[mentioned in Dwyer’s paper 1991] and Convex hull[G.L.Miller,2002] in constructing the voronoi
geometric system,an emerged pattern of polyhedra will be formed upon the basis
of the distributed intial nuclei.The pattern is made out of intersecting
planes,where each plane is bisecting the distance between 2 nuclei.These
intersections form partitions that define the 3D convex polyhedra or 2D
ploygons.Moreover the shape of the planes could vary from 3 edged
planes(triangles) to multi edges(polygons).The variation depend on the pressure
differences that are caused due to the
nuclei positions and their relation to their neighbors’s positions.In
other words,if the locations are at the same distances,a regular polyhedron
voronoi cell is produced with regular partitions..A very close analogy is the patterns that are formed due to soap
bubbles interaction.
Voronoi
polyhedron due to equal influences of nuclei in 3D space.
5. Why Voronoi Diagram ?
1.In a real world, a spatial system such as a building
space is covered with endless number of
sensory points that carry visual information about the objects in this space. From one sensory point we can see one or more of
these objects and from another we can see different objects. , but there are
points from which we can see the most of the object manifestations. The visual
information that we collect from these points is important to navigate or
search for our target. The voronoi can give these maximum points in the space.
It has the ability of tessellating space by dividing it into convex sub regions
(convex hull polyhedra in three dimensions).These sub regions are defined by
bunch of intersecting points that constitute the partitioned boundaries of
these volumes. The points could be shared by other cells and hence one point
could be a strategic point from which we can see all the volumes that belong to
this point. These points carry maximum information of the volumes relevant to
them.
2.The positions of the sub regions are a
result of relative computations to their nuclei positions with respect to their
neighboring nuclei. The correlations between the volume structure aggregations produce the
entire skeleton of the system. These computations (based on natural computation
that emerge systems like crystals) could free us from the boundaries of the
top-down Cartesian geometries and shapes that define our physical space volumes
(cube or sphere).This free spatial structure suits the idea the phenomenal
space which we form in our metal image has no Euclidean character.
3.The Voronoi diagram has both topographical
and topological connecting structure. Therefore as a representing system it
respects the topological concept of either our space cognition or spaces
connectivity. Since our perception to
space is not ‘already’ constructed but due to human gradual construction via a
step by step decision making and decision execution during our interaction with
this space. Also, the space that we live as Bill Hillier has pointed out is
organized in a very topological sense [space is the machine]. For example we
can’t move from one space to next door just because its topographical proximity
until there is a door in-between, but if this door doesn’t exist, then we should pass through a mediating space
(corridor) between the two spaces
following the topological proximity this time.
4.The voronoi give the opportunity to visualize a spatial
system in three dimensions rather than two dimensions. In many wayfinding and
space studies, for instance the studies that have been done by [Bill Hillier
& Alan Penn 1998] although their analysis was intense and profound, it was
incomplete as their focus was on two rather than the three dimensions spatial
analysis. In fact people when they choose their next step, they choose it on
the basis of what they perceive in 3D space not 2D. A two dimensional analysis
could be more applicable to a building where all its elements are of same
height, in this case we might assume that people are moving in 2D movement ,as
all destinations will be seen at the same level of their field of vision,
whereas if it contains a mezzanine for example and they can see some of their
targets at the mezzanine
level(different level), their decisions criterion ill be based on an extended Two-level vision instead of one
level only, as they can see both spaces: the mezzanine and ground level space
movement. Therefore it is essential to apply wayfinding experiments in a 3D
domain in order to have a more global understanding of the people’s real
perception to the space configuration and its influence on their behavior.
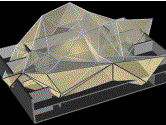
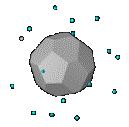
Voronoi
tessellation of a 3D virtual building A convex polyhedron voronoi
polyhedron from inside
6. The mechanical process of the network:
By
using a voronoi network as a representing (mapping) system, we worked on
developing an analytical software tool that is capable to define an
architectural space via analyzing the legibility of this space. In other words,
it shows if the configuration of a spatial system could ease the navigation and
finding the targets of its occupiers or not. The tool mainly interrogates the
influence of the system’s elements on the people’s three common behaviour
abilities: Collecting spatial information; availability to see space location,
Information processing and decision making then manipulating the space.
Now
I will describe each of the network mechanical processes of three abilities
.First, we built a 3D virtual building model in which the reading function of
the software tool can be tested. The mechanical processes of these abilities
are carried out sequentially and by using AutoCAD it is graphically visualized
in order to facilitate our analyzing observations to the tool’s outcomes.
6.1
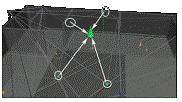
Information collection ability
1.A set of
starting space points (Voronoi nuclei) have been located in the middle of each
space in the building. Every nucleus identifies the space and by using
Voronoi’s algorithms, a voronoi network system is constructed where each volume
cell in the system defines a space volume in the building. The nuclei have been
visualized as cone shape objects.
2.Wayfinding
is to choose a certain target and try to find the way towards it. Therefore,
one or more targets locations can be chosen by the user of the software. Once
they are specified their color changes to distinguish between them and the
other nuclei points.
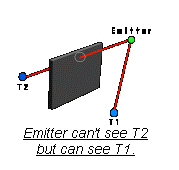
3.Then each node in the network collects its information about this target by checking its visibility to it. For that A ray trace algorithm has been used by letting each node send a ray towards the target and see if it’s blocked or not.
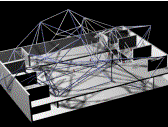
Voronoi
Network in a virtual building model
6.2 Information
processing and decision making
In
a real world, the person chooses topologically his next position either towards
a seen target or another location with a possible view to the target. The first
choice is to choose as the next visual
sensory point in the space from which he can either have the best vision of the
target(as he approaches it for example) or hope to have this vision. Accordingly,
we let the network nodes (which are regarded as abstract representations to the
sensory points) to decide their next nodes by themselves in order to find their
way towards the target location. The wayfinding rules which were mentioned in
section 2 have been used as the nodes’ decision making criteria.
Algorithm:
1.Normally
way finders start their searching journey from a starting space (ex: Building
entrance).Again the user can choose the starting spaces by choosing the
required voronoi starting space point. They are referred to as ‘emitter
nuclei’, once they are chosen their color changes to green. In the beginning of
the program, only the emitter nodes (i.e. voronoi nodes that are related to the
emitter nucleus) are the nodes that have a privilege to choose their next node.
2.The
emitter chooses its next nodes among its connected and only seen network nodes
(The mathematical ray trace algorithm was used to check the nodes vision to
each other). Now the chosen node has the privilege to choose its next neighbor
node. These decisions are taken in a procedural and linear way that is similar
to the way finder’s linear decision making during navigation in the real world.
Furthrmore, we choose a path or route to move from one place to another,
likewise the network nodes decide its next point step and the connected edge as
the required route for this step.
3.We
assigned a weight value to each node, bywhich it could know if it is capable to
make a decision or not (only if weight > 0) and indicates the no of times
each node has been chosen. In other words the more a node is chosen the more
its weight increases and vise versa. The nodes with weights > 0 are called
‘active nodes’, the ones less than or equal zero is called ‘passive nodes’.
4.Weights weren’t only assigned to the nodes but also to the used or chosen routes which lead to those nodes. The more a route is used the more its flux increase (weight).For visual observation when the weight values of either the nodes or edges increase, their colours and radii increase as well.
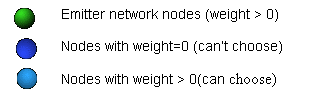
The
emitter is modeled as a green cone and its space volume is defined by four
nodes (green nodes). Indications
of the network nodes and their initial weight values.
1.The
wayfinding criteria that have been used to decide the next node were classified
to two types:
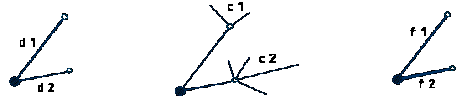
Target rule: If ‘active’ nodes (weights > 0) can see the target, they search among their connected routes for the route with minimum heading between itself and ‘target’ location.
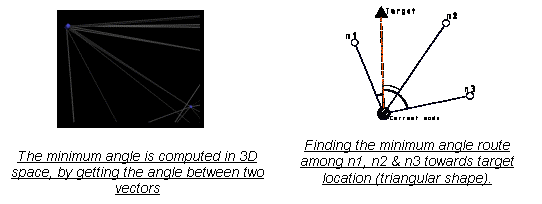
Non-Target
rules: If ‘active’ nodes can’t see
their target, finding the ‘optimum route’ towards the node with highest
probability of seeing the target will be their aim.
This
time the rules upon which they decide their next network nodes and edges are:
l
Searching for nodes
with minimum distance.
l
Searching for nodes
with highest no of connections which means more routes connected.
l
Searching for routes with
highest capacity (flux) and this means that many people have used it. People
tend to follow the flow of others when they can’t determine their targets.
l
By using a three dimensional
vector where each criterion represents dimension, the node with highest 3D
vector magnitude is the one with highest probability
Distance
2 > distance 1
![]()
6.3
Decision execution and manipulating the space
The Voronoi system is divided to two parts: a network that
represents or defines the whole building in three polar dimensions and space
points (voronoi nuclei), upon which the network is constructed, represent each
of the building spaces, respecting the Euclidean characteristics of the space.
From a different view, the space points can be assumed to be people in
different locations in the building and their movement are affected by the
physical spatial boundaries (gravity and differences between the building
stories).This could give the opportunity to find out if any person could reach
the specified target location from any place in the building or not and hence
could evaluate the degree of its intelligibility.
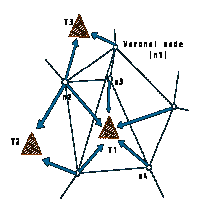
Algorithm:
l
Every node in the
network checks its relevant voronoi nucleus (space point) and feedback its
weight value to it. The nucleus in turn adds up the value to the other values
that are received by the rest of its voronoi nodes.
l
Then all nuclei
simultaneously compare their sum weights with their network neighbors’ weights.
Each nucleus or space point assimilates other points with higher weight values.
Basically, the weight values indicate the number of usages of the relevant
nodes and so the amount of information that these nodes know about the target
location.Therefore, if one nucleus has low value means low chance to find the
target location, but by assimilating the ones with high values it might has a
better chance for finding its target. This mechanism is referred to as ‘Hill
climbing mechanism’.
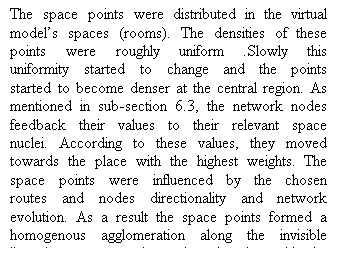
l
The emerged pattern from this
mechanism can be described in terms of the different densities of the space
points and directionality of these densties.In other words if the space is
intelligible enough, most of the space points will aggregate towards the
target(s) locations(high density),else they will scatter.
6.4
Recursion and learning mechanism
Piaget
mentioned that the cognition of space is a recursive human gradual construction
and not given a priori [Piaget and Inhelder].Also
Penn and Turner pointed out that the cognitive space required to support the
representation of the more global understanding of configuration based on same
form of learning form the experience For
example, we all take the same route everyday when we go to
work, school or club. Every time we go through it we see the same elements
(houses, street posters, light posts...etc) and therefore every time we compute
the same information .Hence, the more we learn about the knowledge that
manifests the route, the more this
knowledge becomes apparent and comprehensive. This is referred as a leaning
mechanism.
Algorithm:
l
On the basis of the
recursive and learning concept, the three behaviour mechanisms(information
collection, processing and execution) are carried out recursively for number of
times that we referred to as ‘generation period’. During each generation either
both the same nodes and routes are chosen or different ones. When the same
node/route is chosen their radius increase and become bigger; indicating that
same amount of information is used and hence emphasized.Ofcourse, these
increasing values are sent to the voronoi nuclei. So if the same nodes are
chosen the space points (nuclei) move in the same direction, else they move in
diverting directions.
l The recursion give time for the network to complete its decision making process and either find the target(s) locations or loose its way (the routes that are used might drift of the target).
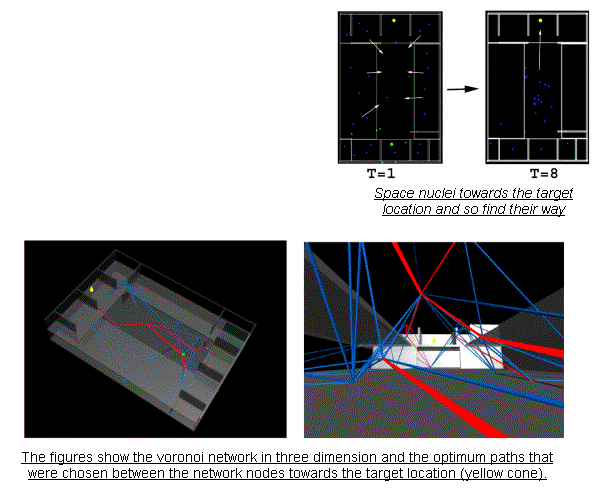
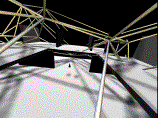
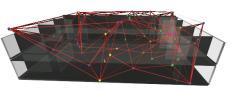
7. Experiment
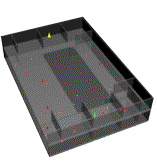
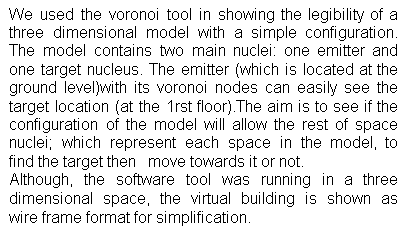
Above
figure shows the virtual model
and space nuclei of cone shape bodies. The emitter is a green cone, target
is yellow and the rest are red.
In a
procedural and linear way, the optimum routes from the emitter to the
target are chosen
At t=1 the emitter nodes (green dots) start choosing their initial
routes(red bars) towards the target location(yellow dot).Since the green dots
could easily see the target-with no obstacles-the decision making criterion
used was ‘target rule’[see sub-section 6.2].The chosen routes were of minimum angle between itself and the yellow
dot. At t=3 more red bars started to form, which means more nodes with high
ability to collect information about the target were chosen. Eventually, the
chosen routes started tended to become straighter and hence started to define
the optimum directionality towards the target location
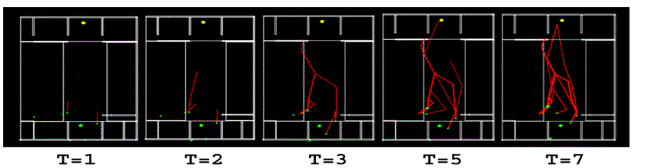
Every
time the network adjusts their locations according to their weight values,
different representation of the space is produced.
In
the beginning, the voronoi network was constructed according to
Voronoi/Delauany algorithms. The nodes locations were based on the building
spaces locations and their configuration, giving an initial representation to
this building. As explained all the nodes except the emitter nodes were with
weight values equal zero. At t=1 each node started to check its privilege to
start the decision making algorithm and its vision to the yellow dot location.
As soon as the first route and nodes were chosen, their values incremented.
After each choice, each node used ‘hill climbing’ method to adjust its
locations by moving towards its neighbour nodes with high weight values.
Consequently, the global voronoi system evolved, giving a different
representation and hence different routes decision were taken. As it is shown
in the above figures, the network position has ended at the central region of
the building where the nodes can see the most of the target location and so can
be chosen and increase their values .Each step could be regarded as learning
step that emphasized the decisions that
were
taken from the step before.
Due to
the network evolution, the space points (nuclei) either find their way or
get lost.