Evolving urban structures
using Computer
Optimisation Techniques.
E. L. Finucane, MSc, C. Derix, MSc, P. S. Coates
School of Architecture and Visual Arts, University of
East London.
e-mail:
christian.derix@uk.aedas.com,
p.s.coates@uel.ac.uk
Abstract
This paper investigates the
use of computer analogies for naturally inspired optimisation techniques as an
aid to developing the site layout and massing for the new World Trade Centre
development in Pristina Kosovo, which is being designed and developed by 4M
Group architectural company, in conjunction with the Advanced Modelling Group
Aedas. The development of a genetic algorithm will incorporate various
techniques, that have been developed in the field of multi-objective
optimisation, to create three dimensional massing models, and site layout
solutions which partially fulfil the Prisina brief requirements, which are
taken from specifications created by 4M Group. Genetic algorithms are based on
natural evolutionary principles which are explained in this paper. It will
incorporate Pareto concepts to manage the optimisation of the various objective
functions. For example, these will include volume and position of units, which
will ensure that the different and sometime conflicting needs of the site are
balanced throughout the optimisation. This type of problem is often known as an
NP-complete (non-determinate polynomial time) problem. This will provide
architects and planners with a number of Pareto optimised site massing
solutions as an aid to the design process.
An initial investigation into
the specifics of the Pristina site requirements, will be followed by an
investigation into the the genetic algorithm which is created in Visual Basic
for Applications (VBA) linked with AutoCAD as the graphical output of the code.
The embryology (development) of the various solutions from the genetic
information incorporates an ‘ant’ pheromone trail model, which simulates the
action of ants during food foraging, as a tool for initial route planning
within the site. Diffusion and cellular automata are used during the
development of the solution to construct the massing for the site.
1. Introduction
The arrangement of areas
within an urban development site, known as space layout planning is one of the
most complex and difficult of the formal architectural design problems. These
space layout problems can be divided into topological and topographical
requirements. Topologically with regards to the relationship of the site
elements to one another, and topographically with respect to the position and
size of these elements. The interplay between these two spatial concepts, under
the influence of various constraints determined by the brief requirements,
which includes volume requirements, and the arrangement of land use zones in
urban development, or building use zones in Architectural site layout planning,
accounts for a huge number of possible variations, not all of which are valid
layouts. The importance of unquantifiable concepts such as environmental
harmony and the quality of space for its users, within urban developments,
compounds the scale of the problem, making it impossible for architects to check
every eventuality.
The use of computers as a
problem solving tool analogous to natural problem solving techniques was first
explored by Nobel Prize winners Herbert Simon, and Allen Newell in 1956 with
the Logic Theory Machine and in 1957 with the General Problem Solver,
programmed on a computer developed with the help of J. C. Shaw. Together they
paved the way for computer problem solving and applying analogies to natural
systems. In his book “Administrative Behaviour” Simon sets out the principles
he uses in the development of artificial intelligence and simulating human
decision making [23]. Genetic algorithms are however not classed as artificial
intelligence, rather artificial life. They also have very powerful problem
solving capabilities, but using different paradigms.
Genetic algorithms and ant
pheromone models have been successfully employed to investigate urban site
layout by a number of researchers including Feng and Lin [6], and Balling, et
al [1], these algorithms are capable of taking into account both topological
and topographical considerations in the site plan. Multiobjective optimisation
techniques are used to search a vast theoretical database of potential layouts,
with a view to locating the optimal set of solutions to the various problems. In
order for the multi-objective optimisation methods to analyse, and subsequently
display, the solutions to the site layout problem, a visual representation of
the various factors must be created. Various methods have been used for this,
many of which revolve around generative shape grammars, based on linguistic
grammar systems [3]. These produce a vocabulary of design elements, and
transformations of these elements, that describes a space using a set of rules
to generate shapes of varying complexity. This technique has been investigated
by Stiny and Mitchell [21], and Koning and Elizenberg [14], although the most
common method for representation is the placement or generation of rectangular
units on a plan [21]. Two dimensional computer generated grids have also been
used for the creation of sketch maps in urban planning [6].
2. The Pristina Site Requirements
The Pristina site for the
World Trade Centre development is one of the last undeveloped areas in
Pristina, Kosovo. Located adjacent to the city centre it is in an ideal
position to form the vanguard to new development in the area. The aim of the
construction project is to create a dynamic multifunctional area, which
accommodates the many needs of the city including habitation, leisure and business,
acting as a hub where people can meet and socialise. The development will group
together economic, social, and environmental needs and stand as an initial
development in a large growth of the surrounding area, providing much needed
regeneration, and bringing a new vibrancy to the city centre. An overview of
the site is visible below (fig. 1)
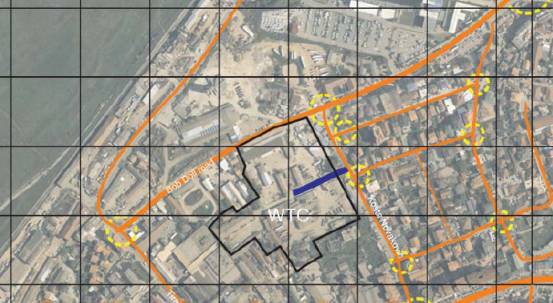
Fig. 1: World Trade Centre
site, Kosovo.
The site is flanked on two
sides by the Bob Dole and Kosta Novakovic roads. However it is as yet uncertain
as to whether access will be available from the Kosta Novakovic road, as the
development rights on the site immediately adjacent to the road are still in
question. The site will have two or three entrances depending on the
availability of the Kosta Novakovic entrance.
A number of site
considerations must be taken into account when realising the initial design
phase of the construction project. These factors are generic across most
constructions of this type and include, amongst many other factors, the plan
depths and subsequent distance from natural light of any part of a building,
the development costs and the plot densities, in this case 30 percent of the
total ground area of the site 8,000 m2 from a total 26,000 m2.
In addition to these considerations, the relative area requirements of the
different mixed usage types, for example, 7500 m2 of hotel space and
the total massed volume of the constructions on the site must be taken into
account.
|
|
Retail |
Office |
Hotel |
Residential |
Total |
|
Volume m2 |
39,000 |
30,000 |
7500 |
70,000 |
153,000 |
|
Storey limit |
-1 to 3 |
2 to x |
6 to x |
2 to x |
|
|
Plan depth m |
min 15 max 45 |
min 13 max 21 |
Min 8-11 max 13-20 |
Min 8 -11 max 15-21 |
|
|
Undeveloped/developed ratio |
|
|
|
|
70/30 |
Fig. 2: Site layout requirements, which will be used as objective
functions in this investigation.
These are just a few of the
myriad of other factors which must be considered. There are also many less
definable qualities, such as pedestrian access and flow through the site, which
should be optimised to ensure maximum efficiency in use. A select few of these
factors have been chosen for further investigation; these are shown in the
table above (fig. 2).
Clear similarities can be
found between the topological and topographical constraints required at the
Pristina site, and the work of Jo and Gero [12], or the Sketch Layout Model,
which demonstrates the relationship between the layout of the land and the
interconnecting network within. Feng and Lin [6] incorporated a multi objective
program with a genetic algorithm to explore the layout of a town, with respect
to two layout entity objects, which denote land usage, and the space to
represent the transport links (fig. 3)
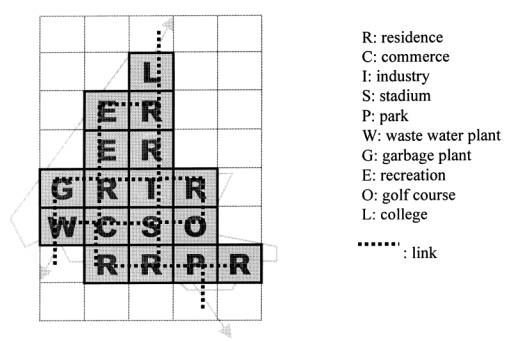
Fig. 3: Sketch layout of Tanhai New
Town, Taiwan.
The topological and
topographical positioning and interrelationships between land usages and office
layouts can be directly paralleled in this particular problem. The
investigation of the building usage type, volume requirements, position, and
floor constraints exhibits all the NP-complete qualities found in the urban and
site layout planning problems.
This investigation will use the chosen site
considerations identified in the Pristina site as the objective functions in a
multi objective optimisation genetic algorithm, which incorporates the site
requirements. The study will also include the use of an ant pheromone
optimisation model as part of the embryological development analogy to find
optimised paths and routes through the Pristina site. These will act as the
foundation for the arrangement and layout of the massing on the site, which
will consist of three dimensional (3D) constructions from which information
concerning the volumes of the different usages, the plan depths, and the
overall volume, can be extracted and used as the basis for evolutionary selection
and the construction of the fitness values. The genotypic solutions expressed
as massing models will be rendered to AutoCAD using flattened 3D cubes as the
basic unit of shape, arranged in a 3D grid formation which has topological and
topographical connections. This 3D grid is represented within Visual Basic for
Applications (VBA) as a 3D array of cells, each representing 4–16 m2
of floor space. Each cell contains information pertaining to its usage type
(retail, office, hotel, residential), the cells distance horizontally from an
outside area, which relates to the relative plan depth of the cell unit, and
the floor which the cell is on. Various processes control the developmental
embryology of the site massing solution, from the initial genetic information
that defines the solution. Xiao, et al, (2002) used a 128 x 128 cell based
representation/ embryological mechanism in which individual cells were assigned
a cost value and the overall cost of the site was totalled. The breeding and
reproduction was based on a genetic crossover mechanism that exchanged one
individual’s position with another’s shape, a similar mechanism was used in
this investigations.
3. The Multi Objective Optimisation Genetic Algorithm
Natural optimisation methods
have been successfully exploited for synthetic implementation in numerous
fields from site layout planning and network routing, to turbine blade
optimisation in aviation engineering, producing reliable flexible results over
a wide range of disciplines. Although genetic algorithms have been
traditionally used to solve single objective problems, a higher order genetic
algorithm, the multi objective optimisation genetic algorithm has been shown to
be highly effective at tackling types of ill-defined, ‘wicked’ problems. A
number of real world applications of this type of genetic algorithm have been
proposed in areas such as geographical studies, site planning, and engineering.
For example David Goldberg [8] developed a genetic algorithm to control gas
pipeline systems by adjusting the compressors within the pipelines, which
subsequently controlled the pressure levels within the system. Goldberg’s
algorithm was capable of meeting the operational requirements of the system,
and within cost, it was even capable of creating a hierarchy of rules capable
of responding to holes in the pipeline system. Xiao, Bennet, and Armstrong [25]
investigated the theoretical use of genetic algorithms in site search multi
objective problems to find the optimal trade off within a site between the
overall costs of the site against the distance of the site from the facilities,
using a non dominated sorting mechanism to evenly distribute the selection
criteria. Genetic algorithms have been used in a more engineering based field. An
example is Hasenjager and Sendhoff’s [10] work with the multi objective
optimisation of turbine blade design, balancing the mass averaged pressure loss
which controls the aerodynamic qualities of the blade against the pitch wide
static outlet pressure, with a view to obtaining a Pareto front of optimised
results.
The multi objective
optimisation genetic algorithm used in this investigation has a haploid (single
stranded) DNA analogy, as opposed to a diploid (double stranded) mechanism. This
will be explored further in the concluding comments. The DNA analogy is
constructed from a binary string variable, each gene being represented by a
string of 0’s and 1’s that are summed to a value for each gene, which is passed
over to the developmental process as a variable value in a construction
process. These values are then scaled for the needs of the embryology. A
variable type was created to hold each individual solution’s genetic
information, this contained the DNA binary string, and a number of fitness
variables, each would relate to an individual objective function, a crowding
variable provided information pertaining to the ‘niching’ value of the
individual solution. Crossover and mutation, as developed by Goldberg [8], are
used as the tools of evolution allowing the genetic material of one parent to
exchange with another. In haploid systems the only way of exchanging genetic
information is by performing crossover, unlike diploid systems in which each
individual receives a single stand of DNA from each parent, and the phenotypic
traits are determined by a mix of crossover and dominance. Six-point crossover,
where the binary strings were crossed over six times, was used in this example
to ensure a more even mixing of the genetic material of each individual.
The objective functions
explored in this investigation, as described above, were incorporated into the
genetic algorithm as the fitness function, encouraging the evolution of the
individual towards the ideal solutions for these objectives. The fitness
function was constructed to selectively favour completed solutions whose
objective type results had the lowest error margin. This value is arrived at by
subtracting the ideal volume from the achieved volume, for example, the error
value for the retail volume is calculated by evaluating the constructed 3D
model to ascertain the total volume of the summed retail components and
subtract the ideal target volume (39,000 m2).
4. Fitness Function
Pareto based multi objective
optimisation techniques, first proposed by Goldberg [8], aimed to produce a spread
of various solutions along the Pareto front, avoiding convergence on one of the
objective functions such as the offices would all be in correct positions but
the retail would not. Goldberg’s model used a fitness function that assigned an
equal probability of reproduction to all non dominated members of a population,
placing them in concentric fronts; assigning front one to the first set of non
dominated solutions found. These are then removed from the population and the
next current non dominated front is found and assigned front two. This
continues until all the individual members of the population have been assigned
to a front [7]. Once all these graduated fronts are found, the members of the
population are each assigned a fitness value based on their front positions. Non
dominated ranking was further developed by Srinivas and Deb [20] when they
proposed the Non dominated Sorting Genetic Algorithm (NSGA) and later by Deb et
al [5] with the NSGA-II Algorithm. This Non dominated sorting technique is employed
in this experiment to give the individuals objective function a fitness value. The
code for creating the various concentric fronts is shown below. Each population
solution checks if its objective error is lower than every other member of the
population, if the objective error is found to be higher, a variable is
increased by one. This variable informs the fitness function how dominated the
particular solution is in any of the objective functions. The i j loop within
the code, completes one cycle, if not all the solutions have been added to the
first Pareto front the routine will loop again to fill the second Pareto front
and so on. The solutions in the first Pareto front are given a correspondingly
better fitness function than individuals in subsequent lower Pareto fronts. This
concept is illustrated in the pseudo code below.
Do while fronts all found =
false
For i= 0 to total population
If population(i)in_front = 0 then
For j = 0 to total population
If population(j).in_front = 0 then
If population(i).objective1_error
> population(j). objective1_error then
Num_that_dominates_me(i)
= num_that_dominates_me(i) + 1
End if
End if
Next j
End if
Next i
For i = 0 to tot pop
If num_that_dominates_me(i) =
0 then
Member(i).in_front = front_num
End if
Next i
front_num = front_num + 1
loop
The Initial objective values
over which an individual was judged to be non dominated or dominated were: the
volume of individual states, how many cells of a particular state were too deep
in a plan and therefore too far from natural daylight and the total volume of
the massing. Whether the initial path laying mechanism has laid down a valid
path without isolated unusable areas and whether each cell has at least one
horizontal neighbour were also added as extra fitness variables. This totals to
9 or 11 non dominated solution states that must be selected for. This high
dimension rate requires a greater number of generational runs before
optimisation, as more factors have to be independently searched for. In
addition to the non dominated qualities of an individual, the number of
objective functions an individual was non dominated in, for example, an
individual who was non dominated in only one area for instance hotel volume
would receive a lower fitness function than a member that was found to be non
dominated in both retail volume and residential volume. The aim of this
mechanism is to selectively favour individuals who are closer to meeting the
requirements over a broad range of objective functions.
5. Selection Techniques
A weighted ‘roulette wheel’
[8], followed by binary tournament selection was used to select two individuals
eligible to enter the archive, which is used as a storage and breeding pool
consisting of the current Pareto front, this is based on the PESA and SPEA
mechanism’s which both use an external population in which to store the non
dominated members [4]. The roulette
wheel code used in this investigation is a simple and effective function
which uses the total sum of the combined fitness values. A random number is
chosen between one and the sum of all the solutions fitness values, the
function then counts through the individuals along their fitness values, when
the count reaches the random number, the individual the function is pointing at
is chosen as the winner.
Function roulette(sumfitness
As Double) As Integer
Dim a_random_number As Double, part_of_sumfitness As Double
part_of_sumfitness = 0
j = 0
a_random_number = Rnd(1) * sumfitness
Do
j = j + 1
part_of_sumfitness =
part_of_sumfitness + oldpop(j).fitness
Loop Until ((part_of_sumfitness > a_random_number) Or (j =
max_population_size))
roulette = j
End Function
Once these two individuals
enter the archive another non dominance and fitness competition takes place to
determine which two members of the archive will be removed now that two new
members have joined. The archive is kept to a constant size which is set by the
operator, so must be paired back down to size after each generational addition.
The fitness function criterion in this removal process is based on a crowding
or niching method developed from Horn, et al’s paper [11] on ‘niched’ Pareto
genetic algorithms which relates to an archive member’s similarity to another
member. The lower an individual’s similarity value the greater they are
penalised in the selection process for removal, decreasing the probability of
their selection, in relation to a more crowded individual. Two breeding
individuals are subsequently chosen from the archive using the same system as
is used in the selection of individuals to enter the archive. These parents are
then crossed over to exchange their genetic material with each other and
undergo mutation to introduce unquantifiable factors into the gene and
occasionally take the evolutionary process in unexpected and sometime
successful directions.
The embryological process is initiated and each of the
genetic offspring are ‘grown’ so their phenotypes are expressed, and the whole
genetic process can be repeated with this new generation.
6. The Embryological Development of the Layout Plan and Massing Volumes.
The genetic string of each
individual in the population contains the information for the development of
the phenotype. In nature the DNA of an organism holds the information for the
construction of polypeptides and proteins which drive the development of the
organism. The values from the decoded chromosome strand are passed to the
development routine where they are used as values in various processes. The
factors within the phenotype which are under genetic control include the number
and position of ‘food sources’, which relate to initially randomly chosen
central destination points within the site, the number and position of the
height seed points and height values, and the number and position of state
seeds, and the relevant states such as retail, office, hotel, residential
states. Variations in the genetic values that control these factors
subsequently change the values relating to the rule set. This is how the DNA
controls the phenotypic expression in this case.
The initial unit for the embryological development of the
phenotype is a Visual Basic user variable type, called cell, this is analogous
to cells in nature. Each cell contains information pertaining to position,
usage type, and various fitness variables, which relate to the individual
objective functions, and other developmental processes.
The cell variable type is
created as a two dimensional grid which is mapped to the outline shape of the
Pristina site plan which is an AutoCAD polyline, this grid is used as the
initial environment from which the ant pheromone paths and eventual massing
will be etched. The initial action of the phenotype development routine is to
lay down areas within the site that will be left undeveloped and used for
public access and passage through the site. This will be approximately 30
percent.
7. Ant Pheromone Inspired Routing System
The passage of pedestrians,
or traffic through an urban development site, is intrinsically linked to the
placement of usage zones to achieve mutually compatible adjacency when
investigating site layout planning. A number of local authorities have
instigated pedestrian orientated policies within urban centres [13]. The
Greater London Authority (GLA) has placed it at the forefront of its policy of
urban regeneration, with an aim to improving the walking experience of the
pedestrian [15]. The Royal London Royal Borough of Kensington and Chelsea, and
London Borough of Ealing have implemented pedestrian centric policies. This
shows a growing need for systems that can accurately predict the movement and
behaviour of pedestrians within an urban environment. The Transport for London
(TfL) and Central London Partnership have developed a system which adopts agent
based movement to predict the walking volumes on a street network [13]. The
Transport Analysis and Simulation System (TRANSIMS) developed by Nagel,
Beckman, and Barrett [17], at Los Alamos National Laboratory, also utilised
agent based modelling and socio-economic data of various zones to create
traffic simulation models. STREETS [19] focused on the activities of
pedestrians in an urban district using agent based models to predict the
behaviour of pedestrians.
Analogies to ant pheromone
trails are left behind while ants are foraging for food have been successfully
used in solving the classic ‘travelling salesman problem’ of finding the
shortest routes to a number of different places, a method often used for
network routing where optimised routes and network connections can
significantly improve the overall performance of the system. Being social
insects, ants must organise themselves efficiently in order to function as a
coherent unit and survive. Towards this end ant colonies use a pheromone
marking system to optimise their food foraging. When an ant locates a food
source it will return home, all the while depositing a pheromone trail. Any
other ant that encounters this trail will follow it to the food source and then
return home, also leaving a food trail, subsequently reinforcing the original
path. The pheromone trail evaporates fairly quickly, within 2 minutes [16]. The
subsequent effect of this is the shortest, most efficient routes to the most
bountiful food sources arise, as these paths are reinforced; whereas the unrewarding
less popular routes fade away as the pheromone evaporates. The global shape and
direction of the optimised routes is thus defined by the local knowledge and
actions of the ant.
This model was used due to
its usefulness in investigating the potential movement of pedestrians through
the proposed sites, creating paths and routes that help with smooth movement
within the site. The model was initiated with the various possible entrances to
the site being represented by a cell analogous to the ants nest, one nest is
created per entrance. The position of the entrances is defined in AutoCAD an a
line, the closest cell in the two dimensional cell matrix to the AutoCAD line
is chosen as a nest, and the relevant variable in the cell is activated , which
is a Boolean type of variable. Single, or multiple points are then placed
within the site boundary, and marked on the cell matrix, these are analogous to
natural food sources. The ants are initiated at their nest (entrances). They
are coded to recognise their own nest from the nest of other ants, and will
subsequently return to their respective nests to deliver the food packages (The
ants are represented as AutoCAD lines).
As the ant analogies forage
for food they lay down a pheromone type trail which points towards their
respective nests. This is accomplished via a method which incrementally lays
down less nest finding pheromone on each cell the further they move away from
the nest cell [18]. The ants forage in a fairly random manner until coming
across a food source, at which point they will collect some food (The ants food
variable is set to 1000), note that they have visited that food source and move
on to locate the next food source cell. Once the ant has visited all of the
food sources they search their immediate surroundings using a Moore’s
neighbourhood, named after its inventor Edward Moore, for a pheromone trail
that will lead them back to their nest. Once they have found the highest
pheromone value the ant will follow this pheromone trail back to their home,
all the while laying down a pheromone that points them toward the food, each
cell contains a food pheromone variable which contains this information. The
ants follow the trail by checking their neighbourhood for the cell which
contains the next lowest food pheromone value, and then chooses this as the
next cell to move too. Once the ant has returned to its nest it drops off its
food (the food variable is zeroed) and searches for the cell with the highest
food finding pheromone in its immediate surroundings and if found hill climbs
up this trail to the food source.
This model is not an exact
copy of that used by ants to forage for food. For example, the ant does not lay
down different pheromones for nest and food finding as they instinctively know
which direction either the food or their nest is, this adjustment is made due
to the simplification of the computer system in relation to the natural
systems.
The movement of the ant is
based around the topology of the grid, the ant ‘jumps’ from the centre of one
cell to another, each ant has a topological heading vector which points in the
direction of movement, when the ant is about to move it looks ahead and 45
degrees left and right. If the ant cannot find a food pheromone trail along
this vector the ant will look at all the surrounding patches in a Moore’s
neighbourhood. Unable to find any pheromone the ant will move randomly in one
of the three forward directions. If the ant finds a food pheromone trail on
more that one of the cells the ant will move to the patch with the highest
amount of pheromone and then ’hill climb’ up the pheromone trail to the
required food source.
The optimisation resulting
from this process occurs because the ant which finds the shortest route to the
food or nest, leaves the strongest deposit of pheromones at the food/nest,
therefore any ant completing their tour of the food sources, or arriving back
at its nest, will follow the ant trail with the highest value of pheromone,
With sufficient iterations and a large enough volume of ants, they
instinctively pick up the shortest routes between a number of different points,
as all the possible routes are investigated, the best being the route with the
highest pheromone amount. This system is often employed to solve the
‘travelling salesman problem’ of the shortest route of connections between
multiple points. This algorithm comes into its own with a higher complexity of
different destinations and is often used in the routing of networks, but is
also equally applicable in studying and optimising the movement of pedestrians
or cars around a site or road network.
The placement of pheromones
is represented by the placement of cell units on the two dimensional grid which
represents the build environment. The colour of the cells is derived from a colour
gradient, determined by the amount of pheromone in the cell, in this case
yellow represents a strong pheromone scent, which fades to red as the pheromone
evaporates. The pheromone system is run for 160 iterations with an ant
population of 50 ants per nest, the number of ants should be determined
proportionally to the resolution of the grid, finer resolutions require more
ants as the environment size effectively increases. Once the optimal paths have
been located by the ant system the pheromone trails diffuse outwards
horizontally through the grid until the 8,000 m2 requirements of the
Pristina site have been reached. Once the 70/30 developed to undeveloped ratio
has been ascertained, the area of the site which has not been diffused upon
becomes designated potential building sites.
8. Obtaining the Overall Massing Structure
Each cell in the two
dimensional (2D) grid is assigned a value to identify it as being either in a
developed or undeveloped area, taken from the information provided by the ant
pheromone model. Cells are then seeded within this grid with information
regarding the relative number of storeys above them, these seeds are initially
randomly placed and henceforth under the control of a collection of genes. Each
seed point is controlled by three genes: two for the topological x y placement
of the seed and one gene to define the storey height. Diffusion then takes
place until the various heights have met at their boundaries. This creates a
diffusion map which relates to the relative heights of the massing structure
above. Once this stage has been completed, the 2D grid variable of cells is
re-dimensioned into a 3D grid with a z (vertical) value equal to the highest
diffusion value in the previous height diffusion. Seed points for the different
types of building usage are then placed within the 3D grid, using a similar
mechanism to the placement of the height diffusion seeds. These are constrained
to ensure they are within their height restrictions for the various different
usage states, that is to say no higher than the third floor for retail
seeds. These state seeds then diffuse outwards until they reach a different
diffusing state and then stop, creating a boundary state between the two
different usages.
An infected diffusion
mechanism was used in this case as opposed to an infecting diffusion mechanism
used in the height diffusion. In an infected diffusion mechanism each cell
checks their surroundings, if they find a cell which is of a valid state they
then take on board that cell’s identity and become infected by the cell,
whereas in an infecting system each cell checks its surroundings and passes
their identity and state values onto the surrounding cells. Once this
development process has finished, the completed individual solution is evaluated
and the information required to ascertain the fitness function is extracted,
these include amongst others, the total volume for each usage type, and the
total volume for the completed massing. This development process is initiated
by every individual in each generation, once every solution’s embryological
process is finished the evaluation values are used to create a fitness for each
solution, and subsequent selection and breeding.
9. Results
Results were compiled from a
number of runs of the genetic algorithm, at various population sizes and
generations.
The graphs below (fig. 4,
fig. 5) were taken from a 100 generation genetic algorithm run with 35
individuals in the evolving population and an external archive of 18
individuals, with nine objective functions used in these runs. The results are
split into various grouping, in order to best illustrate the optimisation
occurring.
|
|
|
Fig. 4:
Average volume errors for 100 generations, 35 population, and 18 archive
members. |
Although an overall improvement
in each of the objective functions is visible (fig. 4). It can be seen from the
plan depth errors graph overleaf (fig. 5), that not all of the objective
functions have been optimised. The residential plan depth error has increased
over 100 generations; this may be due to the number of individuals in the
initial population. The greater the number of initial starting individuals the
better the results obtained, this is because there is a greater chance of
having a good overall broadly spaced gene pool at the start, also the high
number of objective functions could be causing problems
|
|
|
Fig. 5: All but the residential plan depth errors have improved. Generations
100, pop 35, archive size 20. |
The chart below (fig. 6)
shows the normalised results of all the objective functions used. This was
taken from a run of 75 generations, with a population size of 40 and an archive
size of 20. The crowding factor archive removal method has been changed in this
experiment, to favour the removal of individual solutions with a lower total
number of individuals they are dominant over. This causes the evolutionary
process to more strongly favour solutions with a good broad range of
optimisation across all the objective functions
|
|
|
Fig. 6: Generations 75, population 40, archive 20. |
The scatter graphs below
(fig. 7, fig. 8) show the Pareto trade off between two objective functions, the
more optimal solutions all lie in the left hand corner (lower error values). It
is important to maintain a range along the Pareto front, as not to isolate and
neglect any one of the objective functions during optimisation. As is visible
from these graphs the results following a 100 generation evolutionary run are
fairly well spread along the current Pareto front, and clearly closer to
optimisation that the initially generated population members.
|
|
|
Fig. 7: Graph shows, an appreciable improvement in the objective
functions over time, with the final solutions spread out along the Pareto
front |
|
|
|
|
Fig. 8: Although mores pread out than the final results in fig 11.4,
the graph still shows an overall improvement. |
|
|
|
|
Fig. 9: Graph shows, an appreciable improvement in the objective
functions over time, with the final solutions spread out along the Pareto
front |
This (fig. 9) shows the
summed error value for the volume of the different usage states (retail,
office, hotel, residential). Series 1 represents the results taken following
100 generations, while series 2 shows the initial starting generation which is
randomly generated at the beginning of the run. An overall improvement has
occurred over the evolved time. Some of the individuals have not improved as
much as others with respect to their volume errors, however, the overall line
drawn through their summed volume errors is flatter and is smoother showing
less extreme fluctuations. Fig 10 shows the total normalised and summed errors,
an overall optimisation of 52 percent has occurred over the course of 75
generations.
|
|
|
Fig. 10: Graph shows the total optimisation occuring: Generations 75,
population 40, archive 20. |
|
|
|
Fig. 11: The volume error values
decrease over time, showing a level of optimisation occurring. |
|
|
|
Fig. 12: The plan depth error
values decrease over time, showing a level of optimisation occurring. |
The
graphs above (fig. 11, fig. 12) Show the optimisation of the various objective
functions over 75 generations. The population size in this run was 40 with an
archive size of 20 individuals. The various objective functions can be seen to
be improving over time.
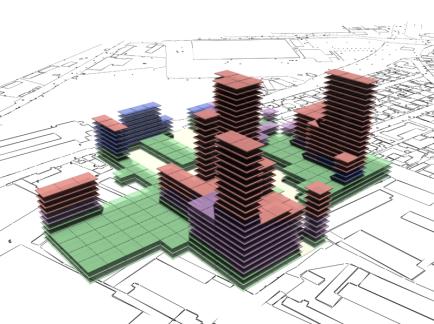
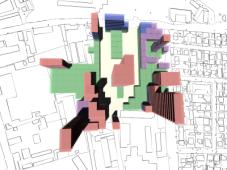
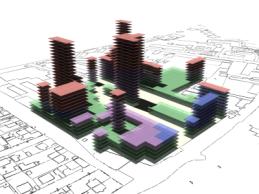
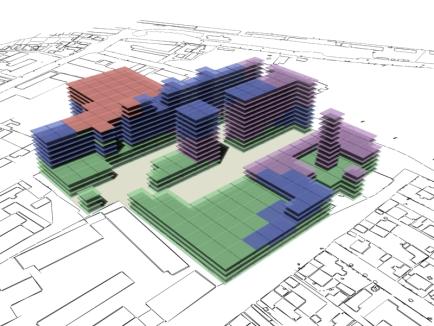
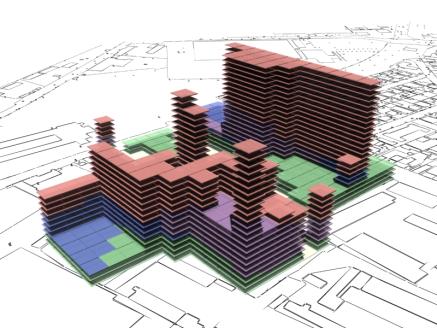
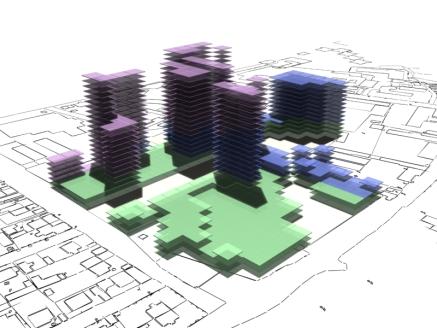
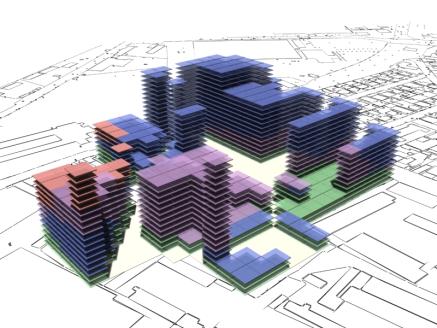
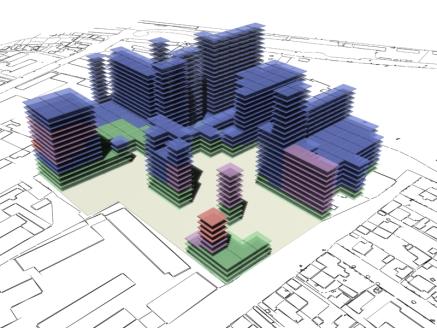
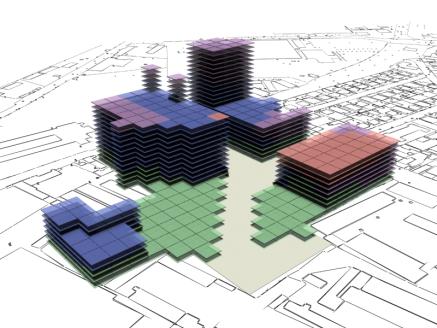
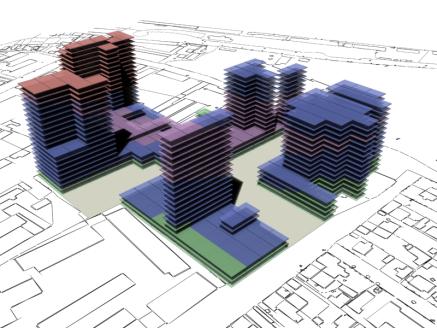
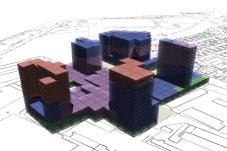
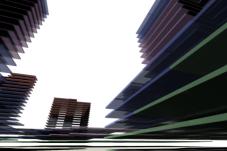
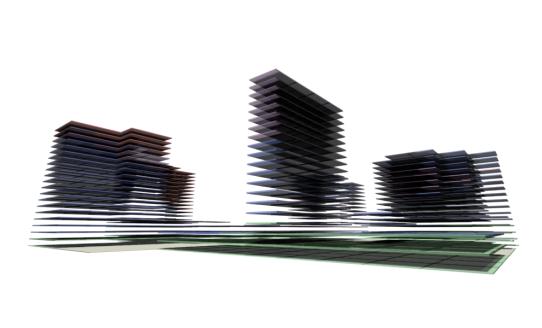
The
following pages show some rendered examples of the final massing solutions. They
have been arranged and rendered in 3D Studio Max, the key below (fig. 15) shows
the different colours used to define the different site area usage. The tables
to the right of the images contain the evaluated data from the adjacent
rendered massing solutions
|
|
|
||||||||||||||||||||||
|
Fig. 13: Rendered results,
evaluation data shown in fig. 14. |
Fig
14. |
||||||||||||||||||||||
Fig 15: Key of colours for the
usage states on all rendered results. |
|
||||||||||||||||||||||
|
|
|
||||||||||||||||||||||
|
Fig. 16: Rendered results,
evaluation data shown in fig. 14. |
Fig 17: Rendered results,
evaluation data shown in fig. 14. |
||||||||||||||||||||||
|
|
|
|||||||||||||||||||||||
|
Fig. 18: Rendered results,
evaluation data shown in fig. 19. |
Fig 19. |
|||||||||||||||||||||||
|
As can be seen in fig 18 and fig 20 there is a tendency for the
solutions to contain a number of isolated cells, where cells become stacked
on top of each other without any adjacent neighbours. |
||||||||||||||||||||||||
|
|
|
|||||||||||||||||||||||
|
Fig. 20: Rendered results,
evaluation data shown in fig. 21. |
Fig
21. |
|||||||||||||||||||||||
|
|
|
|||||||||||||||||||||||
|
Fig. 22: Rendered results,
evaluation data shown in fig. 23. This solution has failed to create any
hotel areas. |
Fig
23. |
|||||||||||||||||||||||
|
|
|
|||||||||||||||||||||||
|
|
|
|||||||||||||||||||||||
|
Fig. 24: Rendered results,
evaluation data shown in fig. 25. |
Fig
25. |
|||||||||||||||||||||||
|
|
|
|||||||||||||||||||||||
|
Fig. 26: Rendered results,
evaluation data shown in fig. 27. |
Fig
27. |
|||||||||||||||||||||||
|
|
|
|||||||||||||||||||||||
|
|
|
|||||||||||||||||||||||
|
Fig.
28: Rendered results, evaluation data shown in fig. 29. |
Fig
29. |
|||||||||||||||||||||||
|
|
|
|||||||||||||||||||||||
|
Fig.
30: Rendered results, evaluation data shown in fig.31. |
Fig
31. |
|||||||||||||||||||||||
|
|
|
|||||||||||||||||||||||
|
Fig.
32: Evaluation data shown in fig.31. |
Fig.
33: Evaluation data shown in fig. 31. |
|||||||||||||||||||||||
|
|
||||||||||||||||||||||||
|
Fig.
34: Evaluation data shown in fig. 31. |
||||||||||||||||||||||||
10. Conclusion
There are a number of
different methods which have been applied over the past 20 years to investigate
multi objectivity with genetic algorithms, most of the variations in these
techniques revolved around changes to the operation of the fitness function. A
considerable amount of the research in this area has used variations on non
dominated sorting. Horn, et al, [11], have aimed to improve the efficiency of
the Pareto algorithms and prevent convergence, fitness sharing has been used in
this investigation to ensure an even spread of solutions along the current
Pareto front. This method uses the concept of crowding to remove the solutions
which have a number of similar solutions.
Many factors were encountered during this
investigation; experiments were performed to investigate the validity and
usefulness of diploid (double stranded) chromosomes in multi objective
optimisation genetic algorithms, and therefore simulating more closely the
common double stranded DNA found in nature, which provides genes with a
mechanism allowing them to have recessive or dominant characteristics. The
results however were found to give no appreciable improvement over the haploid
system (single stranded) within the parameters of this investigation. This is
due to the probable natural reason for DNA being double stranded. It would
appear that the genetic advantages incurred by diploidy are only really
valuable within a dynamically changing environment. Various experiments have
been performed in this field, including work by Golberg [9], Cantu-Paz [2], and
Ticona and Oliveira [23], where diploid mechanisms were found to have their
uses. In nature diploidy allows for the protection and hereditary continuation
of unfavourable (to the current environmental conditions) genes, through the
mechanism of dominance and recession, therefore allowing the genes to be re-expressed
if the environment changes to favour them. A famous example of this is the
peppered moth that changed colour in the industrialised north of the Victorian
era. Prior to the industrial revolution the peppered moth was a light grey
colour, which conferred ideal camouflage against the back drop of a tree
reducing predation. However as the soot from the chimneys of the industrial
revolution stained the wood of the trees, the light grey peppered moth became
easy for a bird to spot, the previously disadvantaged darker peppered moth came
to the fore and flourished. It is not necessary to use diploidy in this
experiment as the environment is static.
As an increasing number of objective functions are
used the greater the number of generations which must be run in order to
achieve a high level of optimisation, this is because a multi objective
optimisation genetic algorithm in many ways behaves as many parallel genetic
algorithms all running simultaneously, as each objective function must be
considered individually and together. Further areas for development include
adjustments of the embryological process to incorporate other factors used in
site layout planning, including the relative orientation of the massing
structures. This is done to increase light penetration into the structures and
therefore avoid large internal areas which are in permanent shadow. It was also
found that the positioning of the food sources during the ant pheromone laying
process failed to evolve satisfactorily. This could be occurring because the
resolution of the grid optimal for this particular project (about 12m2)
is relatively low; therefore it is advisable to only place one or two food
sources to avoid over expanding the undeveloped space. The food placement genes
are also positioned near the beginning of the chromosome sequence as they
appear to have less likelihood of being broken in two and recombined during
crossover. This means the gene is just passed back and forth during evolution
and eventually comes to dominate the archive gene pool. This could be prevented
possibly by placing the gene closer to the centre of the chromosome, which many
improve its mobility. This would be less of a problem if a smaller grid
resolution was used which would allow a greater number of food sources to be
placed and still yield positive results.
Various experiments were
performed with the ant pheromone algorithm to obtain an optimally reliable
result appropriate for the site layout and routing investigation. Initially the
ants were programmed only to visit one food source before returning to its
nest, however, this would often result in paths connecting together the
entrances with the internal food sources, but often resulting in disjointed
paths being created on the site that would fail to fully connect. This was
adjusted so the ants would now visit every food source before returning to
their nest, thus creating paths which would cut through the site from entrance
to entrance providing more useable and pedestrian friendly areas and paths.
The laying of the pheromone
trail also presented difficulties. Because of the low resolution of the grid
used in this investigation the ants would often get stuck, the initial
pheromone laying algorithm would just lay down incrementally less pheromone at
each step and this would occasionally cause problems where an ant would end up
moving round in as tight a circle as their field of vision would allow. This
problem was overcome by using the method illustrated in Panait, and Luke’s
paper [18] where a mechanism was created in which an ant will check its
surroundings every time it is about to lay down some pheromone and lay down an
amount of pheromone that was pre-set to be less than the highest surrounding
value. This ensures a more reliable direction marker in the path. The
relatively low resolution of this particular site model does not allow the ant
pheromone trail to function at full optimality. The technique and power of the
ant pheromone trail models only really becomes apparent at a larger route
finding scale. An example of this can be seen below (fig. 32).
Further improvements can be
made to the embryological process including: optimising the speed of the
program, which allows for greater population sizes and long generational runs,
and improvements to the mechanism which increases the efficiency of the
optimisation process. However, the separation between the site path layout
section of the embryology, and the massing system could be slowing the overall
optimisation, as the lack of interrelation and feedback between these methods
prevents the solutions fitness function and the subsequent selection mechanism
from being accurately controlled by the genetic algorithm. For example, the
embryological mechanism may be unable to fully express the genetic code in a
manageable way.
Although the number of
objective functions in this paper is fairly high for this type of multi
objective optimisation genetic algorithm, significant optimisation is visible
in the results. Because most if not all of the objective functions show a degree
of optimisation it is clear that the Pareto front concept, which ensures a
equal billing to each objective function, is being aided by the crowding and
sharing technique, favouring less crowded solutions during selection.
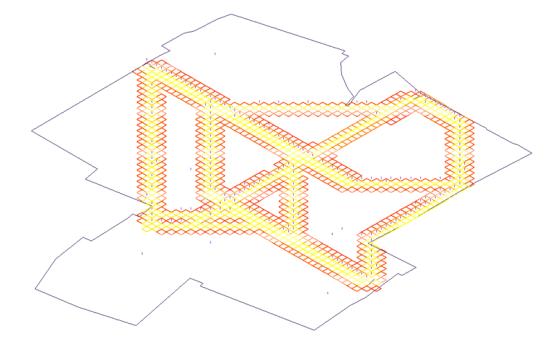
Fig.32:
Results obtained from single ant pheromone run at 3 m2 per cell.
Credits
This
paper has been written for the Advanced Modelling Group at Aedas, using data
provided by 4M Group. It would not have been possible without Aedas’s support,
and also the support of my tutors Paul S. Coates and Christian Derix.
It is ‘the result of the ongoing collaboration
between Aedas Architects and the Centre for Evolutionary Computing (CECA) at
the University of East London. Under this scheme selected students on the
Master’s course in computing and design are encouraged to work on live projects
from the AEDAS office, in this case the outline planning of a sector of
Pristina in Kosovo. The result of this collaboration is a piece of research
that may be one of the first practical uses of multi – objective optimisation
using a genetic algorithm in this field. This has provided a flexible tool that
can be used with a wide variety of criteria and morphologies if the development
of this and other projects. It has shown that although the time to develop
research in the school is short (4 months maximum) it can result in a useful
start to a process of design that commercial pressures usually preclude.’
Paul Coates UEL
References
|
[1] [2] [3] [4] [5] [6] [7] [8] [9] [10] [11] [12] [13] [14] [15] [16] [17] [18] [19] [20] [21] [22] [23] [24] [25] |
Balling, R. J., Taber, J. T., Brown, M. R., and
Day, K., 1999, Multiobjective Urban Planning Using Genetic Algorithm, Journal of
Urban Planning and Development, 125(2), pp. 86-99 Cantu-Paz, E. (1995)A summary of research on
parallel genetic algorithms. IlliGAL Report No. 95007, Illinois
Genetic Algorithms Laboratory University of Illinois at
Urbana-Champaign. Chomsky, N. (1957) Syntactic structures, The Hague:
Mouton. Reprint. Berlin and New York (1985). Corne, D.W., Knowles, J.D., Oates, M. J. (2000) The
Pareto Envelope based Selection Algorithm for Multiobjective
Optimization. Proceedings of the Parallel Problem Solving from Nature VI
Conference, pp. 839-848. Deb, K., Agrawal, S., Pratap, A., Meyarivan, T.,
(2000) A Fast Elitist Non Dominated Sorting Genetic Algorithm for
Multi-Objective Optimization: NSGA-II. Conference, pp 849-858 Feng, C., and Lin, J. (1999) Using a genetic
algorithm to generate alternative sketch maps for urban planning.
Computers Environment and Urban Systems, 23(2), pp. 91-108. Fonseca, C.M., Fleming, P.J., (1995) An Overview of
Evolutionary Algorithms in Multiobjective Optimisation.
Evolutionary Computation, 3(1), pp. 1-16. Goldberg, D.E. (1989) Genetic Algorithms in Search,
Optimization, and Machine Learning. Addison-Wesley, Reading,
Massachusetts. Goldberg, D.E. and Smith, R.E. (1987) Nonstationary
function optimization using genetic algorithms with diploidy
and dominance. 2nd International Conference on Genetic Algorithms, J.
J. Grefensette, Ed., Lawrence, 1987, pp. 59-68. Hasenjager, M., and Sendhoff, B.(2005) Crawling
Along the Pareto Front: Tales From the Practice. Evolutionary Computation,
2005. The 2005 IEEE Congress on, 1, pp.174-181 Horn, J., Nafpliotis, N., and Goldberg, D.E. (1994)
A Niched Pareto Genetic Algorithm for Multiobjective Optimization.
Evolutionary Computation, 1994. IEEE World Congress on
Computational Intelligence., Proceedings of the First IEEE Conference on pp. 82-87. Jo, J., Gero, J.S. (1995). Space Layout Planning
using an Evolutionary Approach. Artificial Intelligence in Engineering, 12(3),
pp. 149-162. Kitazawa, K., and Batty, M. (2004). Pedestrian
Behaviour Modelling: An Application to Retail Movements using a Genetic
Algorithm. Centre for Advanced Spatial Analysis, University College
London. Koning, H. and Elizenberg, J. (1981) The language
of the prairie: Frank Lloyd Wrights prairie houses, Environment and
planning B, 8, pp. 295-323 Livingstone, K., (2001) The Mayors Transport
Strategy. Greater London Authority, London, A copy of this document is
available as of April 26 2004 at the following website. http://www.london.gov.uk/mayor/strategies/transport/trans_strat.jsp Moody, D. (1993) A
field Study of Ant Trail Phenomenon. Association for Biology Laboratory
Education (ABLE), pp. 99-104. Nagel, K. and Beckman, R.J. and Barrett, C.L.
(1998) TRANSIMS for transportation planning. InterJournal Complex
Systems, 244. Panait, L. A., and
Luke, S. (2004). Ant foraging revisited. Submitted to the Ninth International
Conference on the Simulation and Synthesis of Living Systems (ALIFE9).
pp. 569 Schelhorn, T., O’Sullivan, D., Haklay, M. Thurstain-Goodwin,
M. (1999) STREETS: An Agent-based Pedestrian Model. Centre
for Advanced Spatial Analysis, University College, London. Srinivas, N. and Deb, K. (1995) Multi-Objective
function optimization using non dominated sorting genetic algorithm, Evolutionary
Computation, 2(3), pp. 221-248 Steadman, J.P. (1983) Architectural Morphology: An
Introduction to the Geometry of Building Plans, Pion, London. Stiny, G. and Mitchell, W.J. (1978) The Palladian
grammar, Environment and Planning B 5 pp. 5-18. Ticona, A. and Oliveira, P. M.C. (2001) Diploid
Versus Haploid Organisms. International Journal of Modern Physics
C, 12(7), pp. 1075 1080. Wikipedia, Herbert A. Simon (online). Available from: http://en.wikipedia.org/wiki/Herbert_A._Simon. (Accessed 27 September 2006). Xiao, N., Bennett, D.A., and Armstrong, M.P. (2002)
Using evolutionary algorithms to generate alternatives for multi
objective site-search problems. Environment and Planning A, 34(4),
pp. 639-656. |