Review
paper : some experiments using agent modelling at CECA
This
paper/presentation covers a range of projects by students on the MSc Computing
& design at the University of east London school of architecture and the
visual arts.
Paul S. Coates AA Dipl.
programme leader MSc Computing & Design University
of East London School od Architecture & the Visual Arts
Abstract
- Introduction: NetLogo
exploring emergent tessellations and voronoi / dirichlet diagrams
- Pheromone trails emerging
between buildings using the wearing-out-grass algorithm.
- Use of intelligent agents to
navigate to exits in building plans.
- Sun shading agents self
organise to create building layouts.
Turning the problem upside-down
This paper is a short look at how the business of generating form and space can be made simpler and / or more effective if we stop looking at the problem as a syntactic top down geometrical description of shape using the procedures of computational geometry, and see instead the outcomes as being emergent gestalts of self organising autonomous computational entities in 2D or 3D (commonly referred to as agents).
The actual examples are not offered as a set of good solutions to a set of problems, but very simple algorithms that seem to capture useful global descriptions without having to know what they are. Models such as this are inherently more flexible that the parametric op down versions, because the processes are simple and parallel they can cover a wider range of outcomes than more globally constrained models. Adding very simple extra features into such models has dramatic effects on the outcomes, and Adamatsky [1] has shown that these models are very general computational devices.
These notes are an attempt to show how these models might be adapted to architectural problems, starting with a more general introduction.
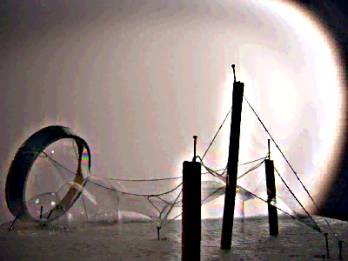
 One of the more successful
workshops that our students do at the start of the msc is the bubble workshop,
which takes its cue from the work of Frei Otto and the way that he modelled
complex curved structures and cable systems using soap films and accurate
lighting rigs. As we like to point out, the shapes are constructed by the
simultaneous operation of all the molecules to achieve the minimum stress to
them personally. A program to simulate such an effect could easily be written,
since the algorithm for each molecule is the same ( mostly to do with
calculating nearest neighbours and applying movement rules) but of course the problem
is that to achieve any useful results we would have to have millions of these
molecule agents (i.e. bags of memory), and very fast computers. The idea that both these possibilities are
just about to happen should surprise nobody, and we can expect to see examples
of these approaches creeping out of the super computer labs pretty soon
(currently the US military use exotic hardware for simulating the electron
trajectories in nuclear explosions but it will not be long before you can do
this on your laptop)
One of the more successful
workshops that our students do at the start of the msc is the bubble workshop,
which takes its cue from the work of Frei Otto and the way that he modelled
complex curved structures and cable systems using soap films and accurate
lighting rigs. As we like to point out, the shapes are constructed by the
simultaneous operation of all the molecules to achieve the minimum stress to
them personally. A program to simulate such an effect could easily be written,
since the algorithm for each molecule is the same ( mostly to do with
calculating nearest neighbours and applying movement rules) but of course the problem
is that to achieve any useful results we would have to have millions of these
molecule agents (i.e. bags of memory), and very fast computers. The idea that both these possibilities are
just about to happen should surprise nobody, and we can expect to see examples
of these approaches creeping out of the super computer labs pretty soon
(currently the US military use exotic hardware for simulating the electron
trajectories in nuclear explosions but it will not be long before you can do
this on your laptop)
In order to understand the kinds of algorithms you need to think of to build models of this sort it is instructive to look at a very simple example of this, taken from the introduction to starLogo “turtles termites and traffic jams
‘other ways of drawing circles’
As part of the “new epistemology”, (the idea that there are new ways of knowing things) Resnic cites the “mathematical” idea of a circle and Seymour Papert’s Logo method. In conventional terms you can get a circle by knowing that a point on the circumference of a circle centred on ORIGIN of radius R is given by:
Xcirc = originX + R cos (angle)
Ycirc = originY + R sin (angle)
However, using the logo turtle drawing method
we can say:
To circle
Repeat 36
Forward 1
Turn Left 10
End repeat
End circle
The first example uses mathematical knowledge without understanding, the second uses an algorithm to drive a little turtle round in a circle, by moving forwards and turning 10 degrees 36 times. As well as being easier to understand (it requires only English and a familiarity with walking) the turtle drawing method is particularly suited to computer implementation since computers are good at doing things over and over again, and the transparency of the process makes it easy to adapt to make different turtle drawings.
.
with parallel computation we can propose another implementation of the circle using not just one turtle but many of them. The algorithm is based on the characterisation of a circle as being:
an array of points all at the same distance from another common point
to do this with turtles we :
- create a lot of turtles at random
- get each turtle to turn towards the centre of the circle
- get each turtle to measure the distance between itself and this centre point
- if this distance is less than the desired radius then take a step back (too near)
- if it greater then take a step forward
go on doing this for ever.
This procedure can be written in netlogo as so:
to
attract
ask turtles
[
set heading towardsxy 0 0
ifelse ((distancexy 0 0 ) <
radius)
[bk 1]
[fd 1]
]
end
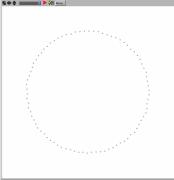
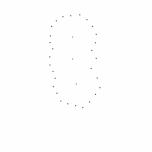
![]() Since this paper is about thinking differently, you should notice
that nowhere in the procedure is it given where the turtles are to walk to,
they just walk back and forth. In fact the “circle” is only apparent to the
human observer, and while we look at it, it shimmers into being rather than
being constructed carefully.
Since this paper is about thinking differently, you should notice
that nowhere in the procedure is it given where the turtles are to walk to,
they just walk back and forth. In fact the “circle” is only apparent to the
human observer, and while we look at it, it shimmers into being rather than
being constructed carefully.
The result is a ring of turtles defining a circle. In fact there is one more thing to do because just using this process will result in an uneven circle with gaps in because the turtles start off randomly and gather in random spacings around the circumference. How can we get the turtles to spread themselves out – the answer is to do roughly the same thing as in attract, but instead of using the global point 0 0 (the centre of netlogo’s universe) we use the nearest turtle’s position, and back away from that
to
repel
ask turtles
[
set
closest-turtle min-one-of turtles with [self != myself] [distance myself]
set
heading towards closest-turtle
bk
repel-strength
]
end
 Again, we don’t tell then
where to go, just to back off a bit. Of course if they do that they may well
get too close to another turtle, but that doesn’t matter because they will move
again and so will all the other turtles and so on and so on…………..
Again, we don’t tell then
where to go, just to back off a bit. Of course if they do that they may well
get too close to another turtle, but that doesn’t matter because they will move
again and so will all the other turtles and so on and so on…………..
![]()
These two procedures, repel and attract form a useful test bed for experiments, and not only in drawing circles of course. Given the high level of abstraction we can begin to model more complex shapes and spatial organisations than individual geometric objects without having to do much extra coding, as an example we can generate the minimum energy tessellation by just using repel without attract. This leads each turtle to move to a position where it is as far away as possible from all the others. With a suitable repel strength the points all settle down in a triangular pattern because whenever they diverge from this grid they are in an unstable situation and will always fall back into the triangular lattice. The point to note is that these wiggles are not in the algorithm (all it states is the backing off principle outlined above). What would one expect from such an algorithm? At first sight perhaps just aimless wandering; however it does in fact settle down as if pulled into alignment by some “force” not implied by the two lines of code. This is an example of “emergence” – the idea that the program, by operating continuously in parallel engenders a higher order observation, which could be characterised as a simple demonstration of the principle that the triangular lattice is the least cost minimum energy equilibrium point for a 2d tessellation, with each point equidistant to 6 others.
It is instructive to compare this bottom up small program with
the conventional recipe for a triangular tessellation. Of course there are many
ways of describing how to draw such a pattern, but using a simple wallpaper
approach you might say:
Wallpaper algorithm (how to draw it)
Set out a line of dots at a spacing of 1
Duplicate this line with an offset of
0.5 in the X direction and the square root of 0.75 in the y direction. Do this
as many times as you like.
The square root of 0.75 is the height of an equilateral triangle of side 1 derived from Pythagoras (where height2 + 0.52 = 12; so h = √1-0.25 ) , which evaluates to approximately 0.86602540378443864676372317075294. This is not a very attractive number and seems to suggest that this algorithm is not capturing the real description of the underlying dynamics, but just mechanically constructing a top down and rather clumsy measurement of the outcome. This distinction should be remembered when simulations and modelling are discussed, as it forms part of the argument in favour of the “short description” encoded in the generative rule rather than the “long description” involved in traditional geometry.
![]()
 A more complex outcome we can achieve with only small modifications
is emergent voronoi diagrams (dirichelet tessellations) with great facility.
Voronoi diagrams are conventionally calculated using computational geometry. A
voronoi diagram is a pattern which describes the minimal energy pathways
between a set of points. Looking at such a diagram we can see that each initial
point is separated from its immediate neighbours by being enclosed in a
polygon, face joining the polygons of all its neighbours. Below is an example
generated by the author (the hard computational geometry way) of such a diagram
(this is actually a recursively defined voronoi after 6 recursions).
A more complex outcome we can achieve with only small modifications
is emergent voronoi diagrams (dirichelet tessellations) with great facility.
Voronoi diagrams are conventionally calculated using computational geometry. A
voronoi diagram is a pattern which describes the minimal energy pathways
between a set of points. Looking at such a diagram we can see that each initial
point is separated from its immediate neighbours by being enclosed in a
polygon, face joining the polygons of all its neighbours. Below is an example
generated by the author (the hard computational geometry way) of such a diagram
(this is actually a recursively defined voronoi after 6 recursions).
Generating voronoi diagrams the easy way
Taking the two procedures attract and repel we can make a small modification to the attract one, so that instead of turtles being attracted to the constant location 0 0 they are interested instead in another of the turtles acting as a “target”. So we can make two kinds of turtles – normal ones and targets. Both the normal turtles and the target turtles obey the repel rule, but the attract rule only applies to normal turtles, who try to stay at a particular radius from the target turtles
to
attract
locals
[targets]
ask
turtles
[
set
targets turtles with [target = true]
set
closest-turtle min-one-of targets with [self != myself][distance myself]
set
heading towards closest-turtle
ifelse
((distance closest-turtle ) < radius) [bk 1] [fd 1]
]
end

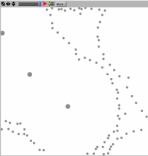
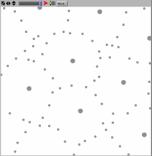 Some experiments with repel and attract
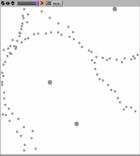
In these diagrams(fig 5) the target turtles are the larger dots and the voronoi diagram is made up of the smaller turtles. Fig 5a shows a fairly tightly packed set of cells where the repel forces are small and the attract force is small also, figs 5b & c show the effect of increasing the attract force of the target cells. Fig 5d shows the effect of reducing the number of normal turtles so as to surround the targets. So by slightly modifying the forces in the system we can observe a range of complex outcomes and different tilings.
![]()
 Similarly, the images below (fig 6) were generated by netlogo using
(6a) a cellular automaton to diffuse the voronoi cells, and (6b) using the
netlogo diffuse procedure to create partial spatial partitions by reaction
diffusion.(white cells are the emergent boundaries equidistant between the
initial points)
Similarly, the images below (fig 6) were generated by netlogo using
(6a) a cellular automaton to diffuse the voronoi cells, and (6b) using the
netlogo diffuse procedure to create partial spatial partitions by reaction
diffusion.(white cells are the emergent boundaries equidistant between the
initial points)
Emergent spatial occupation and path finding using agents and patches
One of the most relevant models for people who are interested in space is the well known ant-food-finding algorithm. This is in the same vein as the circles and voronoi models in that once again we have to turn the problem upside down in order to cast it in the correct way for agent modelling. In this case the problem is along the lines of :
How can we determine the best position and orientation for paths between buildings on a site, or more generally, given a set of origin and destination points in space, how will people best move between them ? Unit 6 MSc student Chadi Sayed attempted to look at this problem using the ant foraging algorithm.
The ant food finding algorithm starts by ants wandering randomly about on the lookout for food, but with no idea of where it might be found. This is typical of the upside down approach; a human would focus on the problem of how to search for food, how best to triangulate the problem and finally home in on the target, but here we completely ignore this goal oriented behaviour and instead just start out with no idea of where the food is. For the algorithm to work the ants have to:
1 change behaviour when they find food
2 communicate this changed behaviour to the other ants
they do 1 by having some mechanism to smell food, and they do 2 by laying a pheromone trail when they have. In this way they are using the environment to communicate with, and in so doing the environment takes part by evaporating the pheromone trail. This process is called “Stigmergy” which Guy Theroulaz and eric bonabeau[2] demonstrated so well in the case of wasp nests. It is a neat trick because it brings the environment into the feedback loop and helps the ants to orient themselves along well trod paths while ensuring that lesser travelled paths become more and more uninteresting. In order to copy the ants hunt for food therefore we have to provide an analogue of the ground/pheromone system. This is done in the autocad drawing that we have of the site by covering the area with 2d rectangular regions which all start off at colour zero. Agents then wander randomly about and, if they bump into a yellow building then begin to “drop pheromone”which in this context means to increment the patches’ colour number by 1 every time an agent walks over them. In the illustrations above, the pink (light coloured) patches show where the agents have walked most.
![]()

However this is only the beginning. There are two vital things we have to program in for this algorithm to begin to work (running just the situation so far described would simply result in the surface filling up with pink).
- agents hillclimb on the patches. This means that agents, when about to take a step (and after making sure they are not about to walk into a wall) check out the three patches to their left, ahead and right and choose to move in the direction of the one with the highest colour number.
- the patch colours evaporate – i.e. each so many steps of the simulation the patches colour numbers are reduced by 1
![]()
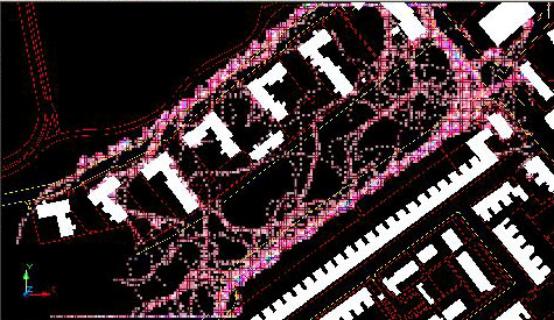
so, the hillclimbing effect the patches because as they get “higher” (smellier) more and more agents walk on them, which makes them get higher colours (positive feedback). Meanwhile the environment fights back by continuously lowering the colour numbers of the patches, so trails that turn out to be over popular and ultimately not really useful slowly fade away. This image shows the result of running this algorithm on a part of Deptford in south London. The “food” was distributed along the edge of the park (top left) and the backs of the terrace housing (bottom right). In a further experiment (below) the large red dots represent the origins of the agents, the “interesting” food is the buildings closest to the dots. The trail has developed into a curving trajectory between these three.
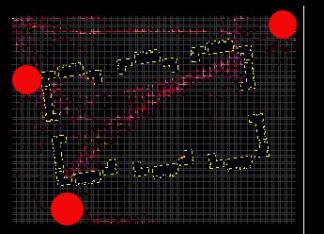

Giving agents methods of finding their way out of a building
There are several commercial packages for simulating the behaviour of inhabitants trying to find their way out of a building. These all use a similar approach :
- the building plan is “coded” with patches (as in the simulation above) which each have information on how far away from themselves the nearest door is and in what direction.
- the agents read the patches and hillclimb on the distance information (choosing the patch with the lowest distance value)
this coding is done by hand, as it were with the building being pre-processed after all doors, stairs etc have been identified. The agents do have some intelligence, mostly to do with how to behave in crowds, and very advanced simulations can also include “vision” by coding the floor patches for sign visibility, so that the agents can avoid places where the exit signs are not visible, but generally the agents don’t really make up their own minds, they just read the markers in the floor. The question is not “can the agents find their way out”? but simply “how long will it take”.
First, we can see that the coding could be carried out automatically if we were to use stigmergic processes as described above, but Second, perhaps we can provide a little more intelligence to the agents.
The MSc student Hai Ruo (2003 2004) built
on previous work of msc students to explore this problem, by looking at how
agents could check how far they can “see” and then telling one agent could
follow another one if they can see further. Agents are equipped with a number
of probes before them as in the classic “Boids” of Craig Reynolds. The agents’s
ability to negotiate obstacles is affected by the geometry of the probes. Hai
Ro experimented with numbers and lengths of probes and eventually 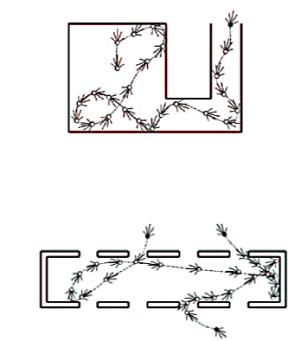 came down to one long probe going forward and 4 side probes. The
long forward probe was used to define the agents’ speed; while the long probe
is not touching anything the agent speeds up. As this happens agents also check
the speed of their neighbouring agents, and adapt their heading and speed to
that of their fastest neighbours. This is an
came down to one long probe going forward and 4 side probes. The
long forward probe was used to define the agents’ speed; while the long probe
is not touching anything the agent speeds up. As this happens agents also check
the speed of their neighbouring agents, and adapt their heading and speed to
that of their fastest neighbours. This is an ![]()
adaptation of the standard “flocking” algorithm (Reynolds 92).
With this in place, after a considerable amount of fine tuning, the agents
eventually all get out – usually after a bit of barging about they suddenly all
shoot off – rather like a party when suddenly everybody mysteriously disappears
and you wonder what you said.
The point of this model is that unlike the pre-processed version (with the plan marked up by hand as it were) it is possible to study the affects of the shape of a space on the agents ability to find their way out, so that this study can be seen as part of a design process, and indeed could be imagined in a loop (as a kind of fitness function) with some space planning algorithm so as to interface this “leavability” property with many other requirements for a space.
Self organising sunshade agents
![]()
Nebille Al-Wahid (MSc student 2002-3) approached the problem
of designing houses to take account of sun direction by reversing the normal
approach – generate a range of assemblies of spaces and test them for
orientation - by designing “room
agents” who had rules of aggregation. Thus there would be south east and west
seeking agents who would move about until they were happy with their position 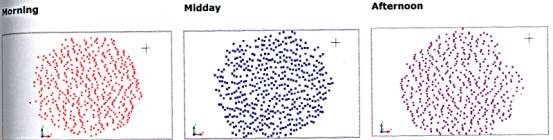
. in this early experiment we can see that, if the world is
full of agents of one type then they will arrange themselves in strings
oriented at 90 degrees to their primary orientation, so that Morning (east) and
Afternoon(west) agents end up in north-south arrangements with gaps dependant
on the building height. South facing agents arrange themselves as east-west
rows (middle picture). Though this could be said to be very obvious, it is
interesting to observe how, starting from a random distribution the agent
blocks form a range of emergent spatial organisations as a result of mutual
perturbation – agents have to move if they are overshadowed, but (just as in
the backing of turtles in the emergent tessellation example) don’t actually
know if they are overshadowing anyone else.
When all three kinds of agents are moving around then the
possibility that they can coexist becomes greater – a west liking agent can go
back to back with an east liking agent and so on, so nebille created some
stigmergic rules – the environment fights back as in Chadi’s pheromone system.
Since there are three kinds of agents (morning noon and evening) then there are
9 basic situations which require negotiation some of which are diagrammed
below. When stuck next to another agent the types of neighbouring agents are
checked and then the agent either moves or stays. The illustration below shows
some of the emergent configurations achievable with this simple program.
Conclusions
Necessarily, these student projects are all at an early stage given the time available in a 12 month course. We have encouraged students to take up earlier projects in order to avoid the starting from scratch every year syndrome, and in this way the agent work has a history of several years. Recently CECA staff member has joined the industry as the program developer for an architectural studio, and has developed some of the approaches to wayfinding outlined here into a useful design tool. We look forward to developing links like this in the near future.
Notes
Netlogo was developed at MIT for the Apple Macintosh computer(1995), and subsequently translated into Java for multiplatform use(2000). Netlogo was written as a consolidation of all previous versions by Uri Wilensky at Northwestern University / Annenberg Hall 311 2120 Campus Drive / Evanston, IL 60208 / USA
Netlogo can be downloaded free at
ccl.northwestern.edu/netlogo/
- Andrew Adamatzky: “Computing in Nonlinear Media and Automata Collectives” Institute of physics 2001 Philadelphia is a very exhaustive survey of the background to the subject, and also contains many illustrative projects written by the author of both cellular and agent based automata for voronoi minmal spanning tree and medial axis transforms using the approach recommended in this paper.
- Bonabeau, E., Theraulaz, G., Deneubourg, J.L., Aron, S. & Camazine, S. 1997. Self-organization in social insects. Trends in Ecology and Evolution, 12: 188-193.