Checking interactive generated design
against distributed objectives
Ir. A. van der Zee.
Faculty of Building
and Architecture, Design Systems Group, Eindhoven University of Technology,
Eindhoven, the Netherlands.
e-mail: a.v.d.zee@bwk.tue.nl
Prof. Dr. Ir. B. de Vries.
Faculty
of Building and Architecture, Design Systems Group, Eindhoven University of
Technology, Eindhoven, the Netherlands.
e-mail: b.d.vries@.tue.nl
Abstract
The demand for low cost houses is increasing along with the technical demands imposed by national building code and regulations. The above outlined problems raise the following questions: 1) Is it possible to generate a draft from these initial design goals; 2) Can the same tool indicate what the best alternatives are; And 3) can the tool indicates what the consequence are of the design changes. Goal of this research is to develop a design tool, based on an integral design strategy, with respect to engineering and spatial layout, which generates different dwelling layout concepts, ‘optimized’ to specific design goals.
1. Introduction
Goal of this research is to develop a design tool, based on an integral design strategy, with respect to engineering and spatial layout, which generates different building concepts, optimised to specific design goals.
Solving a multi-objective problem mostly involves several incommensurable and often competing objectives. Usually there is no single optimal solution but rather a set of alternative solutions. These are optimal in the wider sense that no other solutions in the search space that are superior to them when all objectives are considered.
Its robustness and
similarity with human design process is the reason we use a genetic algorithm
to solve the multi-objective problem. Because of the 'nature' of the genetic
algorithm, we have to code the building into an array of numbers, the so-called
genotype. To implement the genetic algorithm in our tool we face an information
problem. Is it possible to decode a string of (random) numbers into information,
which tells us how to “construct” the phenotype (= a building)?
2. Designing, a
multi-objective goal oriented task
Before the architect can start to design, he must inform himself about
the 'client's brief'. The owner/client states for instance the relationships
between the rooms, the desired area of the rooms, the orientation, the location
of the site, etc. These functional requirements,
performance goals and constraints are the task, which the designer has to fulfill.
After describing the requirements, the architect makes a first draft
design. In the final design he has to evaluate the design in order to check if
the building is designed according to the client's brief, the ruling national
building codes and last but not least his own 'beliefs'. If this is not the
case, the designer has to redesign his initial design. In many cases only a few
'items' are changed after the evaluation. This iterating process of
designing-evaluating-designing goes on till the design meets all the
objectives, and then the process is stopped.
We can look at a building as a collection of 3D objects, namely spaces
and masses. The consequence of this view is that designing has become the
geometrical and topological organization of a set of 3D objects in such a way
that is fulfils a certain set of constrains. In other
words designing is the search for a set of 3D objects that fulfills the
described task, in a multi objective space.
2.2. A genetic algorithm
A genetic algorithm is started with an initial set of random "solutions" (represented by chromosomes) called population. Chromosomes from one population are manipulated to form a new population. This is motivated by the expectation, that the new population will be better than the old one. Chromosomes that are selected to form new chromosomes (offspring) are selected according to their fitness - the higher the fitness, the more suitable they are and the more chances the chromosomes have to reproduce. This is repeated until some end condition (for example number of generations or improvement of the best solution) is satisfied (see table 1)[GOL 88].
|
[Start]
Generate random population of n
individuals [Evaluation] Evaluate the fitness f(x)
of each individual x in the
population [New population]
Create a new population by repeating following steps [Operators]
Manipulation of genetic code to form new offspring. [Accepting]
Place new offspring in a new population [Test]
Stop if the end condition is satisfied, or continue to step [Evaluation] |
Table 1 A Genetisch Algorithm
2.2.1.
Operators
In our genetic algorithm we use the three standard operators:
· Selection: Selection of an individual in the population for reproduction. The ‘fitter’ the individual, the more it is likely to be selected for reproduction, this is called the roulette wheel method.
· Cross-over: A locus is randomly chosen that exchanges the subsequences before and after that locus between two “parent” chromosomes to create two “offspring’s”;
·
Mutation: The building genetic code may be changed, in some random way
before or during reproduction. A random bit in the entire genetic code or in
chromosomes is changed. Mutation is the source of variation in the appearance
or characteristics of an individual building from one generation to the next.
2.2.2.
Fitness Evaluation
The selection operator uses the outcome of some function. This so-called
fitness function or objective is used in the evaluation process to generate fitness values. These values are a fitness measurement of
an individual in comparison to the other individuals. As mentioned, a design
problem consists of many objectives. If we want to use a genetic algorithm, we
have to ‘translate’ the set of objectives into one fitness value, which the
genetic algorithm can handle. There are many different methods developed for that
purpose, our system uses the Pareto method [AZ 2002].
3. The building genome
The complete set of
genetic material (all chromosomes) is called the genome. DNA, the blueprint of
an organism, is a sequence of base pairs; more generally said it is sequence written
in a specific alphabet. In our case the ‘DNA’ serves as a model for the whole
building and is written in the binary alphabet. This abstract representation of
an “object” (organism or building) is called the genotype; the real “object” is
called the phenotype. The
genes that form the DNA-structure (see figure 1) are first decoded into a
sequence of integer numbers, the so-called RNA structure. This RNA-structure is
an intermediate step between Genotype and Phenotype, which makes the
'building-data-model'. With this sequence of integers we can build the
phenotype.
[001100000000101000001010101000001010....]
[1,2.4,5,6,7,8,4,5,43]
Figure 1
The Building Genome (on top the DNA profile, beneath the RNA profile)
In our building genome we recognize two types of chromosomes,
construction-chromosomes and space-chromosomes.
3.1. Construction
chromosome
A construction chromosome stands for a wall construction. A wall is
coded into a sequence of material layers. Each gene stands for a typical
material layer. In table 2 a construction is build up from 9 "genes".
The 'first' gene is the inner layer and the last gene is the outer layer.
|
Genotype |
Phenotype |
||
|
DNA |
RNA |
Meaning |
Construction |
|
0011 |
3 |
Material ID of the
outer layer |
|
|
0000 |
0 |
Material ID of 1st
layer |
|
|
0000 |
0 |
Material ID of 2nd
layer |
|
|
1010 |
10 |
Material ID of 3rd
layer |
|
|
0000 |
0 |
Material ID of 4th
layer |
|
|
1010 |
10 |
Material ID of 5th
layer |
|
|
1010 |
10 |
Material ID of 6th
layer |
|
|
0000 |
0 |
Material ID of 7th
layer |
|
|
1010 |
10 |
Material ID of the
inner layer material ID |
|
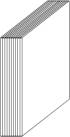
Table 2
Construction chromosomes
Each layer represents a material, because an ID is related to a specific set of material properties in a material database (see table 3). Each property-set maps onto a specific material or product in the real world.
|
ID |
Name |
D [m] |
s [N/mm2] |
l [W/m.K] |
r [kg/m3] |
|
0 |
Empty (cavity) |
|
|
|
|
|
1 |
Wood |
0,15 |
20 |
0,17 |
800 |
|
2 |
Brick -1 |
0,10 |
2 |
0,4 |
800 |
|
3 |
Brick_2 |
0,10 |
2 |
0,6 |
800 |
|
4 |
Brick_2 |
0,10 |
2 |
0,6 |
800 |
|
5 |
Concrete_1 |
0,10 |
30 |
2 |
2300 |
|
6 |
Concrete_2 |
0,10 |
30 |
0,7 |
1600 |
|
7 |
Concrete_3 |
0,10 |
30 |
0,12 |
300 |
|
8 |
Insulation_1 |
0,07 |
0,0001 |
0,033 |
35 |
|
9 |
Insulation_2 |
0,08 |
0,0001 |
0,033 |
35 |
|
10 |
Insulation_3 |
0,12 |
0,0001 |
0,033 |
35 |
Table 3 the material dBase (example)
For simplicity we recognize only two wall types, wall type I, which
separates a space from the outside, and wall type II, which separate two
spaces. The first two chromosomes, in the building genome, represented the two
wall-types; the other ones are space chromosomes.
3.2. Space chromosome
The space chromosomes represent the rooms. The area of a room is coded
as a rectangle. In table 4 a space is build up from 5 "genes".
|
Genotype |
Phenotype |
||
|
DNA |
RNA |
Meaning |
Space |
|
0011 |
3 |
Floor index (=S) |
|
|
0000 |
0 |
x-point corner (=X0) |
|
|
0000 |
0 |
y-point corner (=Y0) |
|
|
1010 |
10 |
Width (=W) |
|
|
0000 |
0 |
Height (=H) |
|
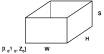
Table 4
Space chromosomes
The first gene is decoded into the floor index; the next pair of genes
corresponds with the angle (rho) and length (lt) of the (polar-) coordinate of
the first corner. The next 2 genes are decoded into the width and height of a
rectangle. The coordinates of the 3 other corners can be calculated with this
information. For the coordinate of the first corner of the rectangle the polar
notation is chosen. The reason is that with only positive numbers the whole x-y
plane is covered. In the current implementation each space has the same height,
2600 mm. This height is chosen because it is the minimum room height according
to Dutch building regulations.
4. Transforming a genotype into a phenotype
As mentioned in paragraph 3, the building is represented by a sequence of “1” and “0”. This sequence is translated into a sequence of integers, which can be translated into construction types and space. The translations from genotype to phenotype isn’t a one to one translation, there are some ‘problems’ that will be discussed in the next sections, which has to be solved before a building can be modeled.
4.1.
Rooms
There are many ways two rooms can be adjacent [BAY 03].
We can easily recognize 4 main categories of room-adjacency, see figure 2. From
these four categories our system recognized three as “well-designed” (figure 2
a, b, c) and one as “ill-designed” (figure 2 d).
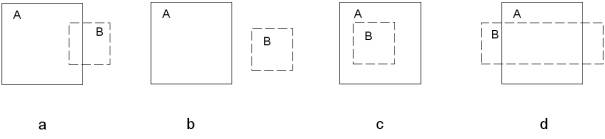
Figure 2 Adjectives spaces
In one of the well-designed solutions (figure 2 a) the both rooms will be redesigned by the system so that they are along side one another. In the ill-designed solution (figure 2.d) two rooms overlap each other. This solution is considered as ill designed because of the indistinctness what to do with the “intersection” part. Does it belong to one of the two rooms, or are there 5 rooms. Because of this indistinctness this solution will get a very bad fitness scores, thus this solution will not propagate through newly formed populations.
4.1.1.
Circulation space
The height of the circulation space needs special treatment, because
this space must be accessible from every floor. The height h is the outcome of
the multiplication of the numbers of floor by the standard room height (=2600
mm).
4.2.
Floor indices
Because of the nature of the phenotype it is possible that some
floor/floor-spaces do not exists, say, we have spaces on the ground floor,
second, third, sixth and eight layer (see figure 8 a). In the data model we
reorganize the data that need re-ordering to get a consistent model. In that
case layers on which the spaces are located are renumbered to become
consecutive (see figure 3 b).
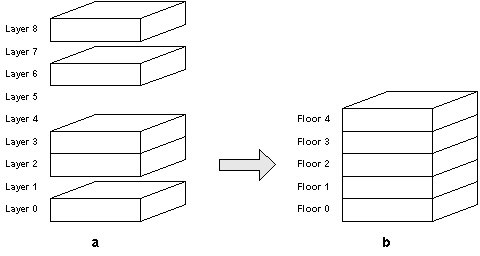
Figure 3 Floor layers
4.3.
Wall layers
For simplicity we don't' merge layers as in real world construction
sometimes is done. For example it is good practice to place, in a timber frame
construction, the insulation between the timber posts. In our model we keep the
insulation and timber posts in separated layers. As a consequence an inaccuracy
is introduced in the outcome of the fitness calculation of some objectives.
Since layers sometimes in practice can be integrated, the wall thickness can be
smaller than calculated (see figure 4).
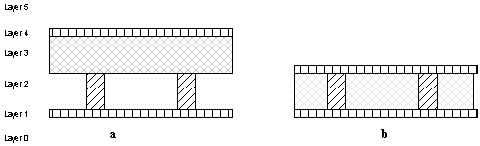
Figure 4
Wall layers
If the inner and/or
outer layers of a wall are made of material “cavity”, they are deleted. From
Table 3 we learn that a material ID with the value of 0 maps onto a ‘cavity’.
5. Objectives
The outcome of the generation process depends heavily on the number of
objectives the phenotype must fulfill. If there are to many objectives the
search space will be to small and the algorithm can't find a solution. If there
are there too few objectives there will be too many possible answers to
inspect.
As indicated earlier, a design is evaluated in order to check if the
building is designed according to the ruling national building codes, the
client's brief and the designer intention. All these different rules of
evaluation form the total set of objectives, which must be fulfilled by the
design. The whole set of objectives can be divided into 3 levels (see table 5),
according to the imposing party of the objectives.
|
Level |
Example |
Imposing party |
|
Primary |
Every building has to fulfill a minimal number of structural en physical demands, for example, the building has to stay erected, give protection against the forces of nature etc. |
Government |
|
Secondary |
A building most also fulfill some specific demands, such as: number and size of the rooms, the function of the rooms etc. |
Client |
|
Tertiary |
These demands consisted of mostly immediate subconscious knowledge, unwritten rules, etc. |
Designer |
Table 5 Level
of demands
Most of the primary objectives are based on national rulings, and can
easily translated into formulas. The secondary objectives are mostly
prescriptive rules and can also easily be translated into formulas. The last
category consists of the objectives, which deal with the beliefs of the
designer and therefore are difficult to translate into formulae.
5.2. Distributing objectives
The ‘owner’ of each of these categories is different. As a consequence
different people maintain each category. The
objectives, which are imposed by the government, have a different status in
comparison to the others, they have to be fulfilled otherwise the designer
can’t get a building permit. These objectives or norms are the tools for the
government to enforce designers to design according some minimum requirements.
Governmental institutes develop these norms. In our digital era most of these
institutes develop computer applications which help the user by their
‘calculations’. However, these norms are not static, they change in due time,
because of 1) gain in knowledge, 2) change in insight and last but not least 3)
accentuation of requirements. These governmental institutes must also look
after the distribution and ‘maintenance’ of these norms.
Every designer and every conformance checking application must use the
ruling norms. Before one can start conformance checking, there has to be a
search for the ruling norms. In order to overcome this problem we introduce the
capability of remote access of primary objectives. In this way the
"owner" of the objective stays responsible for the objective, it improves the validity of information, because it remains under
control of the provider. In this case the user is always certain of using the
latest version of the norm.
6. Implementation
6.1. Client's brief
In order to test the application we use a simple test design project, consisting of 4 rooms, each with a minimum and maximum area. The relations and areas of the rooms are presented Table 6.
|
Rooms |
Relationship between rooms |
|||||||
|
Name |
Min. area |
Max. area |
|
V1 |
V2 |
V3 |
V4 |
B |
|
Circulation space |
5 m2 |
10 m2 |
V1 |
|
|
|
|
|
|
Living |
25 m2 |
V2 |
* |
|
|
|
|
|
|
Kitchen |
10 m2 |
15 m2 |
V3 |
* |
* |
|
|
|
|
Bedroom |
15 m2 |
20 m2 |
V4 |
* |
|
|
|
|
|
Outside |
- m2 |
- m2 |
B |
|
|
|
|
|
Table 6 Client’s brief
In our current system implementation we have used only the 'relation objective' and the 'area objectives'. After this information is entered into the GA, the GA is started. During its run, alternative solutions are generated. The following images (see figure 5) show the outcome at some time during one run of the GA.
|
|
|
|
|
a) Fitness 0.026305 |
b) Fitness 0.961695 |
c) Fitness 0.961112 |
|
|
|
|
|
d) Fitness 0.900165 |
e) Fitness 0.912840 |
f) Fitness 0.95595 |
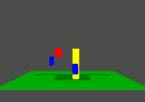
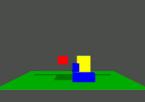
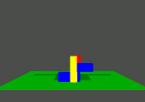
Figure 5 Examples
In Figure 5 a few snapshots are shown which are made during the run of the system. The three rooms are swirling around the circulation space. From this circulation space the other rooms has to be accessible, which is the case in solution b, e and f. During the process the shape and location of the spaces changes, this overall change is also notable in the fitness score. The higher the fitness the better the solution fulfills the objectives.
7. Some conclusions from the project
The building, geometry and material use is represented in one complex
chromosome that evolves in time. A genetic algorithm allows for interpretations
of multiple design objectives that up to now only could by studied in
isolation.
8. Further research
We have to implement more objectives in order to get a more realistic
outcome of the process. Special attention is required to implement windows into
the model. There are a few problems concerned with windows, 1) in which wall a
window or windows have to be located 2) how many windows in a wall; 3) how tall
a window must be. This has rather a big influence on the genotype. The genotype
of a building with 2 wall types and 4 spaces has a length of 2 x 9 + 4 x 5 = 38
integers. A rectangle can be described by 4 integers (see also paragraph 3.2),
therefore if in every wall a window is located; the original genotype has to
extend with at least 4 x 4 x 4 = 64 integers. This extension has a big
influence on the performance of the system, and the time it takes to find a
sufficient solution.
A genetic algorithm, as proposed by Holland, has one big shortcoming for
using as a design 'generator'. It lack's the ability to direct the evolutionary
process. By implementing a feedback method into the genetic algorithm we intend
to manipulate the process. As a result the evolutionary process will be
directing towards a preferred outcome. The extended algorithm will give the
designer better control over the design generation process.
9. Bibliography
[BEN 96] Bentley, P. J.: 1996, Generic Evolutionary Design of Solid
Objects using a Genetic Algorithm, Ph.D. Thesis, University of Huddersfield,
Huddersfield, UK
[BAY 03] Baykan, Can (2003) Spatial relations and architectural plans,
Layout problems and a language for their design requirements, in B.Tunçer,
S.Özsariyildiz and S. Sariyildiz (eds), E-activities in design and design
education, Europia Productions, 2003
[COH 78] Cohon, Jared L (1978) Multi-objective programming and planning,
Academic Press London
[GOL 88] Goldberg David E.: 1988, Genetic Algorithms in Search,
Optimization & Machine Learning, Addison Wesley
[HOL 92] Holland, J, H. 1992 Adaptation in Natural and Artificial
Systems; MIT-press, Cambridge, Massachusetts
[ZEE 02] Zee, van der A. and Vries, de B. (2002)
Computer Aided Evolutionary Architectural Design, in Celestino Soddu(ed.):
Proceedings of the 5th International Conference on Generative Art 2002. Milaan.
pp. 9.1 - 9.13.
[ZEE 03] Zee, van der A and Vries, de B (2003) Evolutionary development
of early stage design alternatives for buildings, in B.Tunçer, S.Özsariyildiz
and S. Sariyildiz (eds), E-activities in design and design education, Europia
Productions, 2003